รูปแบบกราฟ

รูปแบบกราฟนั้นเป็น รูปจำลองทางกราฟฟิกที่ถูกสร้างขึ้นมาในชาร์ตจากราคา อ้างอิงตามหนึ่งในการวิเคราะห์ทางเทคนิค ที่ตั้งสมมติฐานมาว่า ประวัติศาสตร์ (การเคลื่อนไหวของราคา) มักจะเกิดขึ้นซ้ำรอยเดิม นั้นหมายความว่า การเคลื่อนไหวของราคาก็หมือนกับ สถานการณ์หนึ่งที่จะสามารถทำการคาดการณ์ไปยังทิศทางในอนาคต ตามเหตุการณ์ที่น่าจะมีความเป็นไปได้สูง
รูปแบบกราฟที่สำคัญจากทาง InstaTrade นั้นจะเป็นการบริการที่มีการใช้อย่างง่ายดาย ซึ่งจะช่วยให้คุณสามารถทราบถึงการเปลี่ยนแปลงล่าสุด ในตลาดได้ และสามารถรับมือกับข้อมูลจากทางตลาดได้ทันท่วงที ในการบริการของพวกเรานั้น คุณจะพบกับรูปแบบกราฟล่าสุดและมีความสำคัญมากที่สุดในทุกๆคู่สกุลเงิน และทุกๆขอบเขตเวลา
Triple Bottom
was formed on 26.03 at 11:55:30 (UTC+0)
signal strength 1 of 5
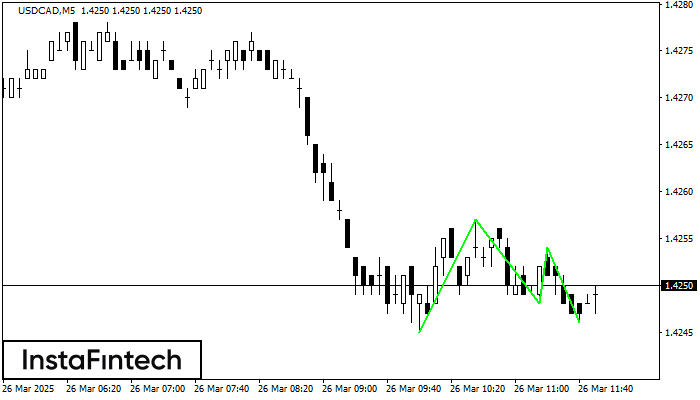
The Triple Bottom pattern has formed on the chart of USDCAD M5. Features of the pattern: The lower line of the pattern has coordinates 1.4257 with the upper limit 1.4257/1.4254, the projection of the width is 12 points. The formation of the Triple Bottom pattern most likely indicates a change in the trend from downward to upward. This means that in the event of a breakdown of the resistance level 1.4245, the price is most likely to continue the upward movement.
The M5 and M15 time frames may have more false entry points.
ดูเพิ่มเติม
- All
- All
- Bearish Rectangle
- Bearish Symmetrical Triangle
- Bearish Symmetrical Triangle
- Bullish Rectangle
- Double Top
- Double Top
- Triple Bottom
- Triple Bottom
- Triple Top
- Triple Top
- All
- All
- Buy
- Sale
- All
- 1
- 2
- 3
- 4
- 5
รูปแบบสามเหลี่ยมสมมาตรขาขึ้น (Bullish Symmetrical Triangle)
was formed on 05.04 at 06:31:21 (UTC+0)
signal strength 2 of 5

อ้างอิงจากชาร์ตของ M15, #Bitcoin ที่ได้สร้างรูปแบบ รูปแบบสามเหลี่ยมสมมาตรขาขึ้น (Bullish Symmetrical Triangle) ออกมา ขอบเขตด้านล่างของรูปแบบสัมผัสพิกัด 83167.44/83888.94 แม้ว่าขอบเขตด้านบนจะข้ามผ่าน 84422.11/83888.94 ถ้ารูปแบบ รูปแบบสามเหลี่ยมสมมาตรขาขึ้น
ขอบเตระยะเวลาใน M5 และ M15 อาจจะมีตำแหน่งการเข้าใช้งานที่ผิดพลาดมากยิ่งขึ้น
Open chart in a new window
รูปแบบกราฟสี่เหลี่ยมผืนผ้าขาลง (Bearish Rectangle)
was formed on 05.04 at 02:40:31 (UTC+0)
signal strength 4 of 5

อ้างอิงจากชาร์ตของ H1, #Bitcoin ที่ได้สร้างรูปแบบ รูปแบบกราฟสี่เหลี่ยมผืนผ้าขาลง (Bearish Rectangle) ออกมา รูปแบบประเภทนี้แสดงถึง ความต่อเนื่องในแนวโน้ม มันประกอบไปด้วยสองระดับ: แนวต้าน 84685.39 - 0.00
Open chart in a new window
รูปแบบกราฟสี่เหลี่ยมผืนผ้าขาลง (Bearish Rectangle)
was formed on 04.04 at 21:58:39 (UTC+0)
signal strength 1 of 5

อ้างอิงจากชาร์ตของ M5, EURUSD ที่ได้สร้างรูปแบบ รูปแบบกราฟสี่เหลี่ยมผืนผ้าขาลง (Bearish Rectangle) ออกมา ซึ่งเป็นรูปแบบของ ความต่อเนื่องในแนวโน้ม รูปแบบนี้จะอยู่ภายในขอบเขตดังต่อไปนี้: ขอบเขตด้านล่าง 1.0924 – 1.0924
ขอบเตระยะเวลาใน M5 และ M15 อาจจะมีตำแหน่งการเข้าใช้งานที่ผิดพลาดมากยิ่งขึ้น
Open chart in a new window