รูปแบบกราฟ

รูปแบบกราฟนั้นเป็น รูปจำลองทางกราฟฟิกที่ถูกสร้างขึ้นมาในชาร์ตจากราคา อ้างอิงตามหนึ่งในการวิเคราะห์ทางเทคนิค ที่ตั้งสมมติฐานมาว่า ประวัติศาสตร์ (การเคลื่อนไหวของราคา) มักจะเกิดขึ้นซ้ำรอยเดิม นั้นหมายความว่า การเคลื่อนไหวของราคาก็หมือนกับ สถานการณ์หนึ่งที่จะสามารถทำการคาดการณ์ไปยังทิศทางในอนาคต ตามเหตุการณ์ที่น่าจะมีความเป็นไปได้สูง
รูปแบบกราฟที่สำคัญจากทาง InstaTrade นั้นจะเป็นการบริการที่มีการใช้อย่างง่ายดาย ซึ่งจะช่วยให้คุณสามารถทราบถึงการเปลี่ยนแปลงล่าสุด ในตลาดได้ และสามารถรับมือกับข้อมูลจากทางตลาดได้ทันท่วงที ในการบริการของพวกเรานั้น คุณจะพบกับรูปแบบกราฟล่าสุดและมีความสำคัญมากที่สุดในทุกๆคู่สกุลเงิน และทุกๆขอบเขตเวลา
Bearish Rectangle
was formed on 05.04 at 02:40:31 (UTC+0)
signal strength 4 of 5

According to the chart of H1, #Bitcoin formed the Bearish Rectangle. This type of a pattern indicates a trend continuation. It consists of two levels: resistance 84685.39 - 0.00 and support 81178.46 – 81178.46. In case the resistance level 81178.46 - 81178.46 is broken, the instrument is likely to follow the bearish trend.
ดูเพิ่มเติม
- All
- All
- Bearish Rectangle
- Bearish Symmetrical Triangle
- Bearish Symmetrical Triangle
- Bullish Rectangle
- Double Top
- Double Top
- Triple Bottom
- Triple Bottom
- Triple Top
- Triple Top
- All
- All
- Buy
- Sale
- All
- 1
- 2
- 3
- 4
- 5
รูปแบบกราฟจุดสองยอด (Double Top)
was formed on 08.04 at 18:20:17 (UTC+0)
signal strength 1 of 5

รูปแบบการย้อนตัว รูปแบบกราฟจุดสองยอด (Double Top) ได้ถูกสร้างขึ้นมาใน #KO M5 คุณลักษณะ: ขอบเขตด้านบน 69.94; ขอบเขตด้านล่าง 69.49; ความกว้างของกราฟรูปแบบนี้คือ 50 จุด
ขอบเตระยะเวลาใน M5 และ M15 อาจจะมีตำแหน่งการเข้าใช้งานที่ผิดพลาดมากยิ่งขึ้น
Open chart in a new window
รูปแบบกราฟธงขาลง (Bearish Flag)
was formed on 08.04 at 18:17:39 (UTC+0)
signal strength 1 of 5

รูปแบบ รูปแบบกราฟธงขาลง (Bearish Flag) ได้สร้างขึ้นมาในชาร์ต GOLD M5 ดังนั้นแนวโน้มขาลงอาจจะยังคงเกิดขึ้นในระยะเวลาอันสั้นนี้ จนกว่าราคาเคลื่อนตัวทะลุผ่านต่ำกว่าระดับต่ำที่ 2993.55 เทรดเดอร์ควรจะเข้าไปยังตลาด
ขอบเตระยะเวลาใน M5 และ M15 อาจจะมีตำแหน่งการเข้าใช้งานที่ผิดพลาดมากยิ่งขึ้น
Open chart in a new window
รูปแบบกราฟธงปลายแหลมขาลง (Bearish pennant)
was formed on 08.04 at 18:17:34 (UTC+0)
signal strength 1 of 5
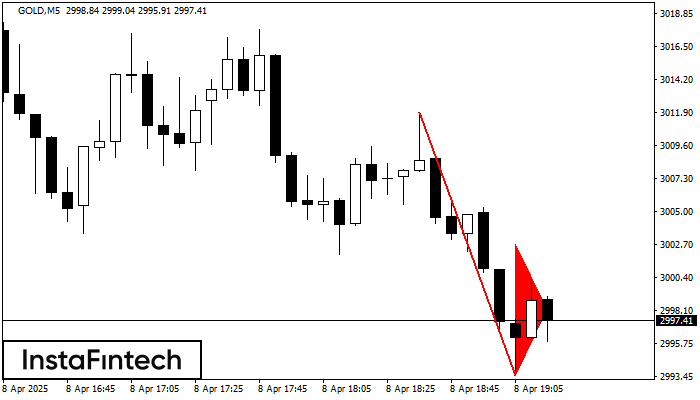
รูปแบบ รูปแบบกราฟธงปลายแหลมขาลง (Bearish pennant) ได้สร้างขึ้นมาในชาร์ต GOLD M5 รูปแบบประเภทนี้จัดว่าเป็นการชะลอตัวลงเล็กน้อย หลังจากที่ราคาจะเคลื่อนตัว ไปในทิศทางของแนวโน้มเดิม กรณีที่ราคาทรงตัวอยู่ต่ำกว่าระดับต่ำของรูปแบบใน 2993.55 เทรดเดอร์ก็จะสามารถเข้าไปถึงสถานะการขายได้สำเร็จ
ขอบเตระยะเวลาใน M5 และ M15 อาจจะมีตำแหน่งการเข้าใช้งานที่ผิดพลาดมากยิ่งขึ้น
Open chart in a new window