Dolzarb patternlar

Двойная вершина
сформирован 16.04 в 09:00:29 (UTC+0)
сила сигнала 4 из 5
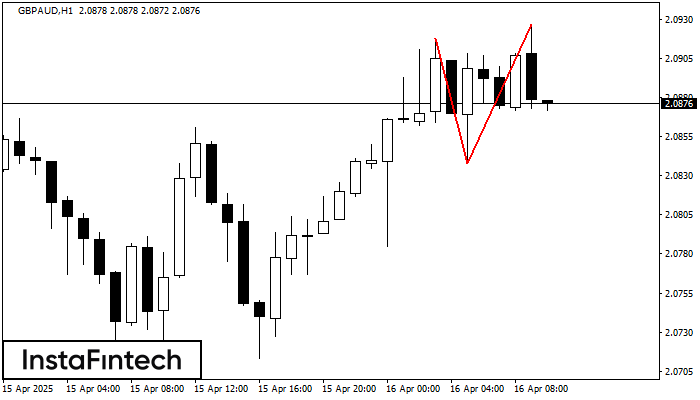
На торговом графике GBPAUD H1 сформировалась разворотная фигура «Двойная вершина». Характеристика: Верхняя граница 2.0927; Нижняя граница 2.0838; Ширина фигуры 89 пунктов. Сигнал: Пробой нижней границы 2.0838 приведет к дальнейшему нисходящему движению с перспективой хода к уровню 2.0798.
- Все
- Все
- Bearish Rectangle
- Bearish Symmetrical Triangle
- Bearish Symmetrical Triangle
- Bullish Rectangle
- Double Top
- Double Top
- Triple Bottom
- Triple Bottom
- Triple Top
- Triple Top
- Все
- Все
- Покупка
- Продажа
- Все
- 1
- 2
- 3
- 4
- 5
Double Top
was formed on 29.04 at 17:14:57 (UTC+0)
signal strength 1 of 5
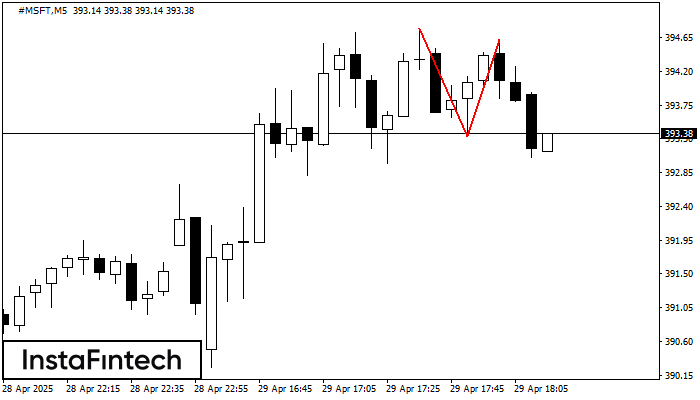
The Double Top pattern has been formed on #MSFT M5. It signals that the trend has been changed from upwards to downwards. Probably, if the base of the pattern 393.33
The M5 and M15 time frames may have more false entry points.
Open chart in a new window
Double Top
was formed on 29.04 at 17:09:59 (UTC+0)
signal strength 1 of 5
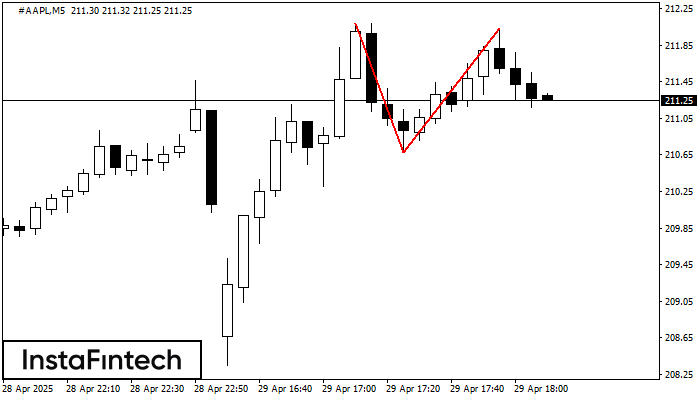
On the chart of #AAPL M5 the Double Top reversal pattern has been formed. Characteristics: the upper boundary 212.03; the lower boundary 210.68; the width of the pattern 135 points
The M5 and M15 time frames may have more false entry points.
Open chart in a new window
Bearish Rectangle
was formed on 29.04 at 17:05:05 (UTC+0)
signal strength 1 of 5
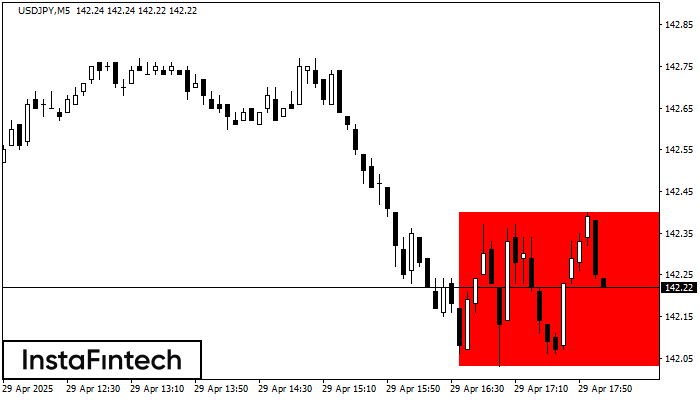
According to the chart of M5, USDJPY formed the Bearish Rectangle. This type of a pattern indicates a trend continuation. It consists of two levels: resistance 142.40 - 0.00
The M5 and M15 time frames may have more false entry points.
Open chart in a new window