Dolzarb patternlar

Двойное дно
сформирован 16.04 в 08:35:10 (UTC+0)
сила сигнала 1 из 5
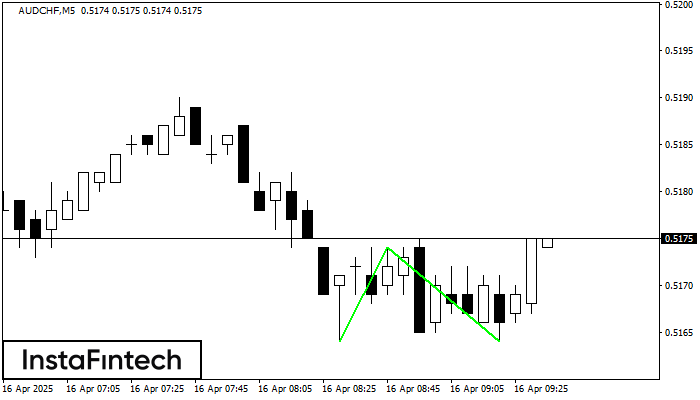
Сформирована фигура «Двойное дно» на графике AUDCHF M5. Характеристика: Уровень поддержки 0.5164; Уровень сопротивления 0.5174; Ширина фигуры 10 пунктов. В случае пробоя уровня сопротивления можно будет прогнозировать изменение тенденции, где первая точка фиксации прибыли находится на расстоянии 10 пунктов.
Таймфреймы М5 и М15 могут иметь больше ложных точек входа.
- Все
- Все
- Bearish Rectangle
- Bearish Symmetrical Triangle
- Bearish Symmetrical Triangle
- Bullish Rectangle
- Double Top
- Double Top
- Triple Bottom
- Triple Bottom
- Triple Top
- Triple Top
- Все
- Все
- Покупка
- Продажа
- Все
- 1
- 2
- 3
- 4
- 5
Triple Top
сформирован 29.04 в 00:30:39 (UTC+0)
сила сигнала 2 из 5
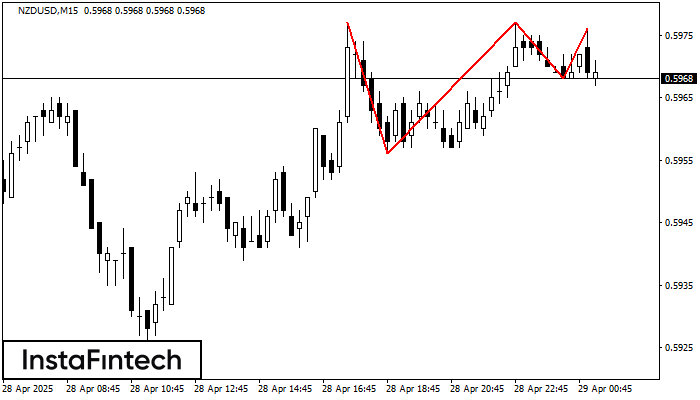
The Triple Top pattern has formed on the chart of the NZDUSD M15 trading instrument. It is a reversal pattern featuring the following characteristics: resistance level 1, support level -12
The M5 and M15 time frames may have more false entry points.
Открыть график инструмента в новом окне
Bullish Symmetrical Triangle
сформирован 29.04 в 00:01:06 (UTC+0)
сила сигнала 2 из 5
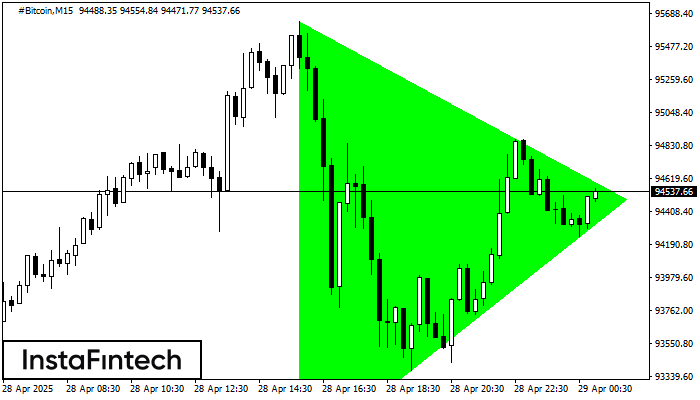
According to the chart of M15, #Bitcoin formed the Bullish Symmetrical Triangle pattern, which signals the trend will continue. Description. The upper border of the pattern touches the coordinates 95636.73/94484.76
The M5 and M15 time frames may have more false entry points.
Открыть график инструмента в новом окне
Double Bottom
сформирован 28.04 в 22:46:00 (UTC+0)
сила сигнала 1 из 5
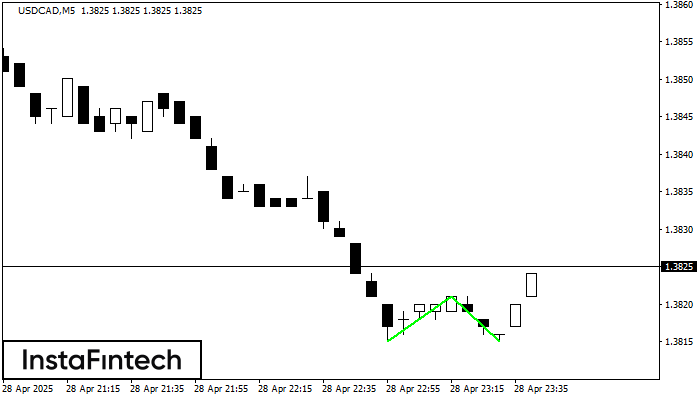
The Double Bottom pattern has been formed on USDCAD M5; the upper boundary is 1.3821; the lower boundary is 1.3815. The width of the pattern is 6 points. In case
The M5 and M15 time frames may have more false entry points.
Открыть график инструмента в новом окне