Dolzarb patternlar

Двойное дно
сформирован 03.04 в 08:29:56 (UTC+0)
сила сигнала 3 из 5
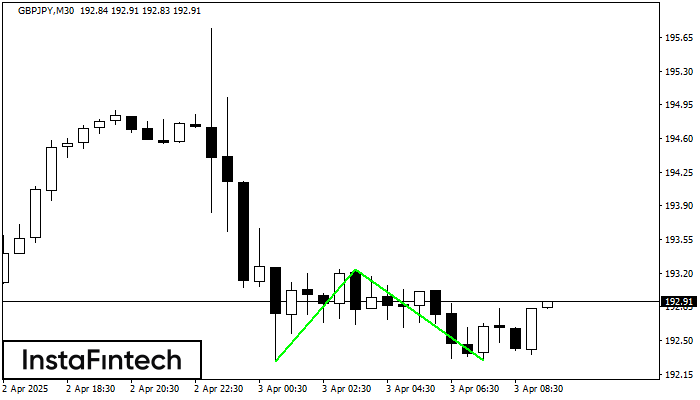
Сформирована фигура «Двойное дно» на графике GBPJPY M30. Верхняя граница 193.24; Нижняя граница 192.29; Ширина фигуры 96 пунктов. В случае пробоя верхней границы 193.24 можно будет прогнозировать изменение тенденции, где ширина фигуры и будет являться расстоянием предположительного Тейк Профита.
- Все
- Все
- Bearish Rectangle
- Bearish Symmetrical Triangle
- Bearish Symmetrical Triangle
- Bullish Rectangle
- Double Top
- Double Top
- Triple Bottom
- Triple Bottom
- Triple Top
- Triple Top
- Все
- Все
- Покупка
- Продажа
- Все
- 1
- 2
- 3
- 4
- 5
Triple Bottom
сформирован 29.04 в 22:15:32 (UTC+0)
сила сигнала 2 из 5
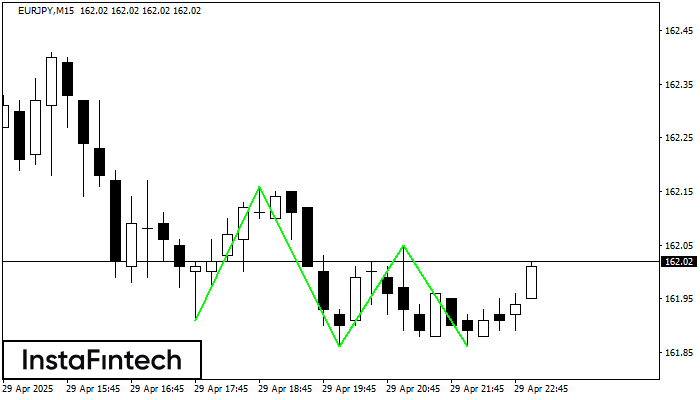
The Triple Bottom pattern has formed on the chart of the EURJPY M15 trading instrument. The pattern signals a change in the trend from downwards to upwards in the case
The M5 and M15 time frames may have more false entry points.
Открыть график инструмента в новом окне
Double Bottom
сформирован 29.04 в 22:05:24 (UTC+0)
сила сигнала 1 из 5
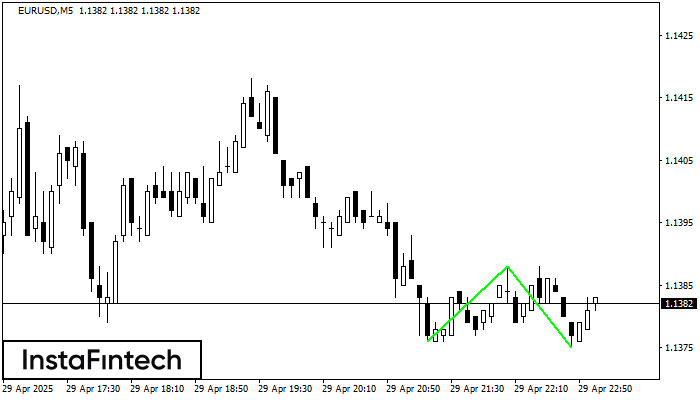
The Double Bottom pattern has been formed on EURUSD M5. This formation signals a reversal of the trend from downwards to upwards. The signal is that a buy trade should
The M5 and M15 time frames may have more false entry points.
Открыть график инструмента в новом окне
Double Bottom
сформирован 29.04 в 22:00:24 (UTC+0)
сила сигнала 4 из 5
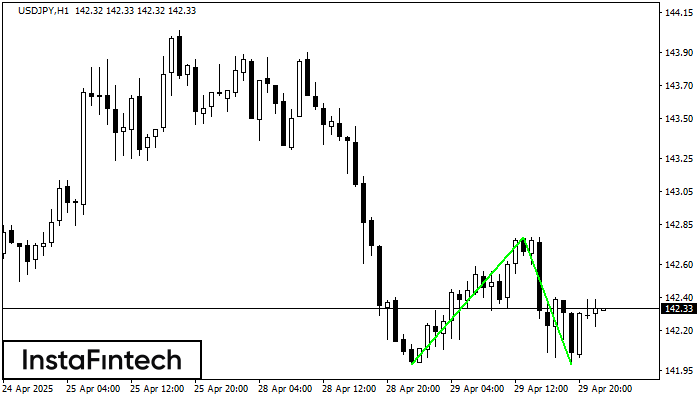
The Double Bottom pattern has been formed on USDJPY H1. Characteristics: the support level 141.99; the resistance level 142.77; the width of the pattern 78 points. If the resistance level
Открыть график инструмента в новом окне