Dolzarb patternlar

Прямоугольник
сформирован 02.04 в 05:02:20 (UTC+0)
сила сигнала 1 из 5
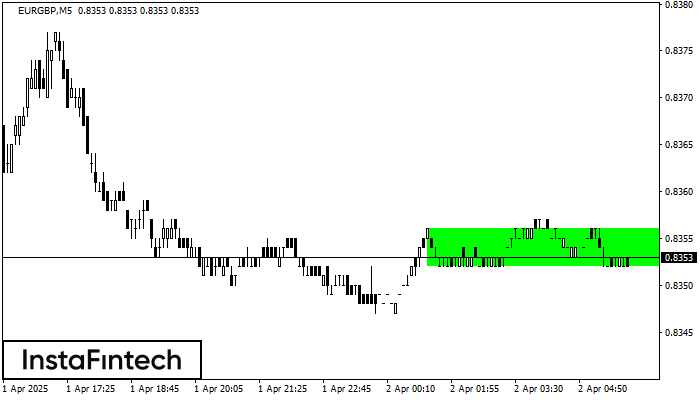
Сформирована фигура «Прямоугольник» на графике EURGBP M5. Тип фигуры: Продолжение тренда; Границы: Верхняя 0.8356, Нижняя 0.8352; Сигнал: позицию на покупку следует открывать выше верхней границы прямоугольника 0.8356.
Таймфреймы М5 и М15 могут иметь больше ложных точек входа.
Shuningdek ko'ring
- Все
- Все
- Bearish Rectangle
- Bearish Symmetrical Triangle
- Bearish Symmetrical Triangle
- Bullish Rectangle
- Double Top
- Double Top
- Triple Bottom
- Triple Bottom
- Triple Top
- Triple Top
- Все
- Все
- Покупка
- Продажа
- Все
- 1
- 2
- 3
- 4
- 5
Bearish Rectangle
сформирован 10.04 в 04:44:16 (UTC+0)
сила сигнала 1 из 5
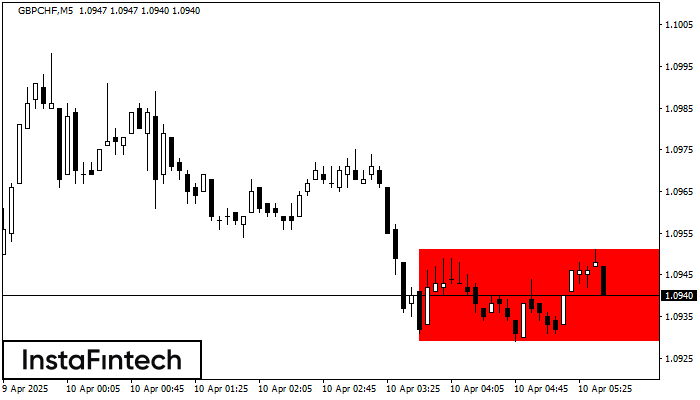
According to the chart of M5, GBPCHF formed the Bearish Rectangle. This type of a pattern indicates a trend continuation. It consists of two levels: resistance 1.0951 - 0.0000
The M5 and M15 time frames may have more false entry points.
Открыть график инструмента в новом окне
Bullish Rectangle
сформирован 10.04 в 04:34:35 (UTC+0)
сила сигнала 1 из 5
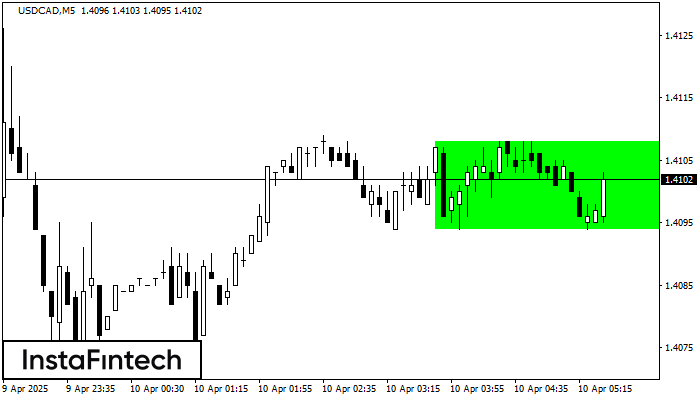
According to the chart of M5, USDCAD formed the Bullish Rectangle. The pattern indicates a trend continuation. The upper border is 1.4108, the lower border is 1.4094. The signal means
The M5 and M15 time frames may have more false entry points.
Открыть график инструмента в новом окне
Bullish Rectangle
сформирован 10.04 в 04:30:30 (UTC+0)
сила сигнала 3 из 5
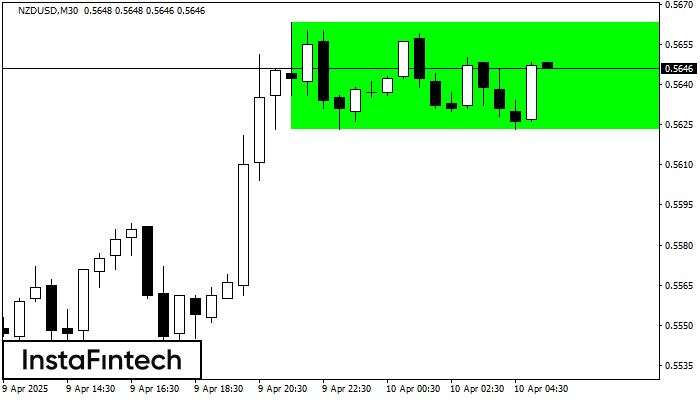
According to the chart of M30, NZDUSD formed the Bullish Rectangle. The pattern indicates a trend continuation. The upper border is 0.5663, the lower border is 0.5623. The signal means
Открыть график инструмента в новом окне