รูปแบบกราฟ

รูปแบบกราฟนั้นเป็น รูปจำลองทางกราฟฟิกที่ถูกสร้างขึ้นมาในชาร์ตจากราคา อ้างอิงตามหนึ่งในการวิเคราะห์ทางเทคนิค ที่ตั้งสมมติฐานมาว่า ประวัติศาสตร์ (การเคลื่อนไหวของราคา) มักจะเกิดขึ้นซ้ำรอยเดิม นั้นหมายความว่า การเคลื่อนไหวของราคาก็หมือนกับ สถานการณ์หนึ่งที่จะสามารถทำการคาดการณ์ไปยังทิศทางในอนาคต ตามเหตุการณ์ที่น่าจะมีความเป็นไปได้สูง
รูปแบบกราฟที่สำคัญจากทาง InstaTrade นั้นจะเป็นการบริการที่มีการใช้อย่างง่ายดาย ซึ่งจะช่วยให้คุณสามารถทราบถึงการเปลี่ยนแปลงล่าสุด ในตลาดได้ และสามารถรับมือกับข้อมูลจากทางตลาดได้ทันท่วงที ในการบริการของพวกเรานั้น คุณจะพบกับรูปแบบกราฟล่าสุดและมีความสำคัญมากที่สุดในทุกๆคู่สกุลเงิน และทุกๆขอบเขตเวลา
Double Bottom
was formed on 03.04 at 14:19:55 (UTC+0)
signal strength 1 of 5
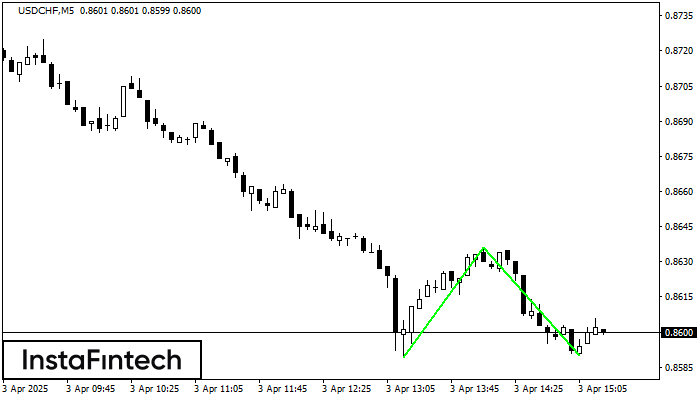
The Double Bottom pattern has been formed on USDCHF M5; the upper boundary is 0.8636; the lower boundary is 0.8590. The width of the pattern is 47 points. In case of a break of the upper boundary 0.8636, a change in the trend can be predicted where the width of the pattern will coincide with the distance to a possible take profit level.
The M5 and M15 time frames may have more false entry points.
- All
- All
- Bearish Rectangle
- Bearish Symmetrical Triangle
- Bearish Symmetrical Triangle
- Bullish Rectangle
- Double Top
- Double Top
- Triple Bottom
- Triple Bottom
- Triple Top
- Triple Top
- All
- All
- Buy
- Sale
- All
- 1
- 2
- 3
- 4
- 5
Triângulo Simétrico de Baixa
was formed on 24.04 at 21:08:21 (UTC+0)
signal strength 4 of 5
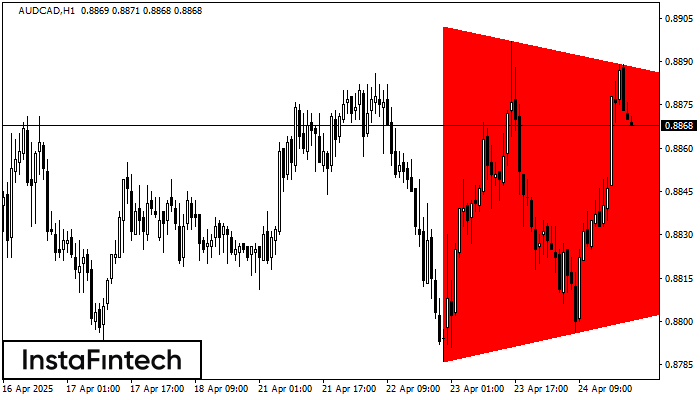
De acordo com o gráfico de H1, AUDCAD formou o padrão de Triângulo Simétrico de Baixa. Recomendações de negociação: Uma quebra do limite inferior de 0.8786 pode encorajar a continuação
Open chart in a new window
Bandeira de Alta
was formed on 24.04 at 21:06:47 (UTC+0)
signal strength 1 of 5
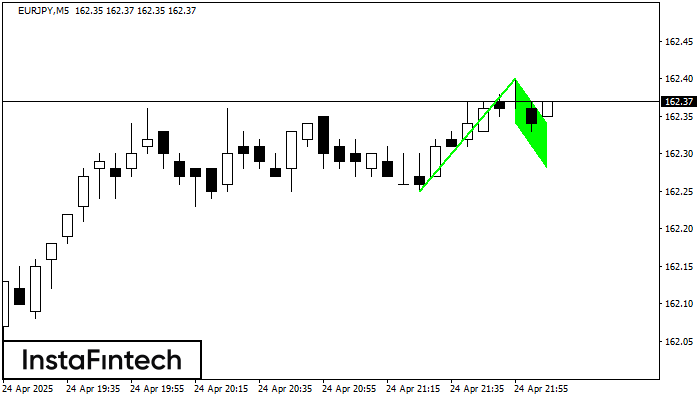
O padrão Bandeira de Alta que sinaliza a continuação de uma tendência foi formado no gráfico EURJPY M5. Previsão: se o preço ultrapassar o padrão de alta em 162.40
Os intervalos M5 e M15 podem ter mais pontos de entrada falsos.
Open chart in a new window
Pennant de alta
was formed on 24.04 at 21:06:43 (UTC+0)
signal strength 1 of 5

O padrão gráfico Pennant de alta foi formado no instrumento EURJPY M5. Esse tipo de padrão se enquadra na categoria de padrões de continuação. Neste caso, se a cotação conseguir
Os intervalos M5 e M15 podem ter mais pontos de entrada falsos.
Open chart in a new window