รูปแบบกราฟ

รูปแบบกราฟนั้นเป็น รูปจำลองทางกราฟฟิกที่ถูกสร้างขึ้นมาในชาร์ตจากราคา อ้างอิงตามหนึ่งในการวิเคราะห์ทางเทคนิค ที่ตั้งสมมติฐานมาว่า ประวัติศาสตร์ (การเคลื่อนไหวของราคา) มักจะเกิดขึ้นซ้ำรอยเดิม นั้นหมายความว่า การเคลื่อนไหวของราคาก็หมือนกับ สถานการณ์หนึ่งที่จะสามารถทำการคาดการณ์ไปยังทิศทางในอนาคต ตามเหตุการณ์ที่น่าจะมีความเป็นไปได้สูง
รูปแบบกราฟที่สำคัญจากทาง InstaTrade นั้นจะเป็นการบริการที่มีการใช้อย่างง่ายดาย ซึ่งจะช่วยให้คุณสามารถทราบถึงการเปลี่ยนแปลงล่าสุด ในตลาดได้ และสามารถรับมือกับข้อมูลจากทางตลาดได้ทันท่วงที ในการบริการของพวกเรานั้น คุณจะพบกับรูปแบบกราฟล่าสุดและมีความสำคัญมากที่สุดในทุกๆคู่สกุลเงิน และทุกๆขอบเขตเวลา
Double Top
was formed on 26.03 at 10:30:57 (UTC+0)
signal strength 3 of 5
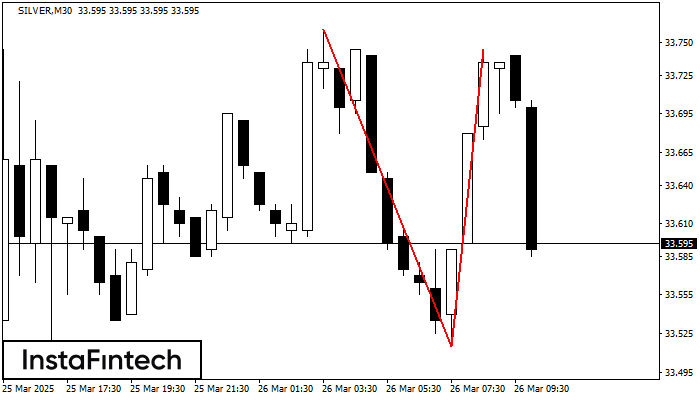
On the chart of SILVER M30 the Double Top reversal pattern has been formed. Characteristics: the upper boundary 33.74; the lower boundary 33.52; the width of the pattern 230 points. The signal: a break of the lower boundary will cause continuation of the downward trend targeting the 33.48 level.
ดูเพิ่มเติม
- All
- All
- Bearish Rectangle
- Bearish Symmetrical Triangle
- Bearish Symmetrical Triangle
- Bullish Rectangle
- Double Top
- Double Top
- Triple Bottom
- Triple Bottom
- Triple Top
- Triple Top
- All
- All
- Buy
- Sale
- All
- 1
- 2
- 3
- 4
- 5
Bearish Symmetrical Triangle
was formed on 08.04 at 13:41:43 (UTC+0)
signal strength 1 of 5
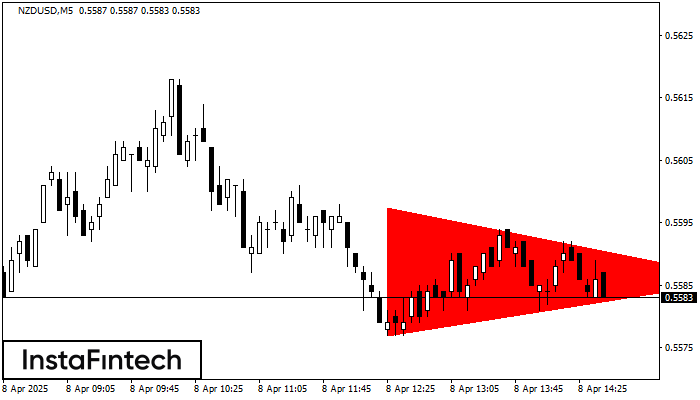
According to the chart of M5, NZDUSD formed the Bearish Symmetrical Triangle pattern. This pattern signals a further downward trend in case the lower border 0.5577 is breached. Here
The M5 and M15 time frames may have more false entry points.
Open chart in a new window
Double Bottom
was formed on 08.04 at 13:15:21 (UTC+0)
signal strength 2 of 5
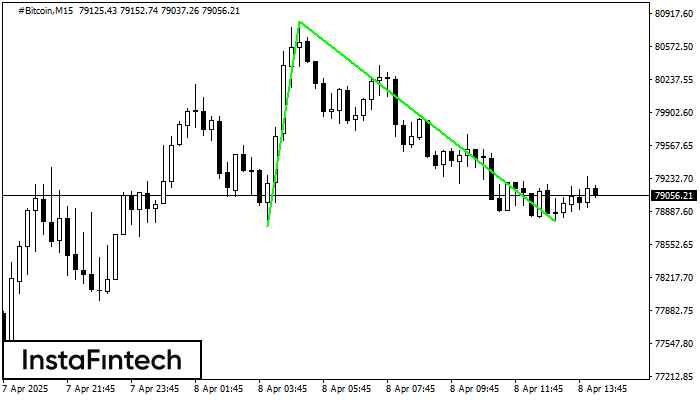
The Double Bottom pattern has been formed on #Bitcoin M15. Characteristics: the support level 78737.33; the resistance level 80832.24; the width of the pattern 209491 points. If the resistance level
The M5 and M15 time frames may have more false entry points.
Open chart in a new window
Double Top
was formed on 08.04 at 13:15:17 (UTC+0)
signal strength 1 of 5
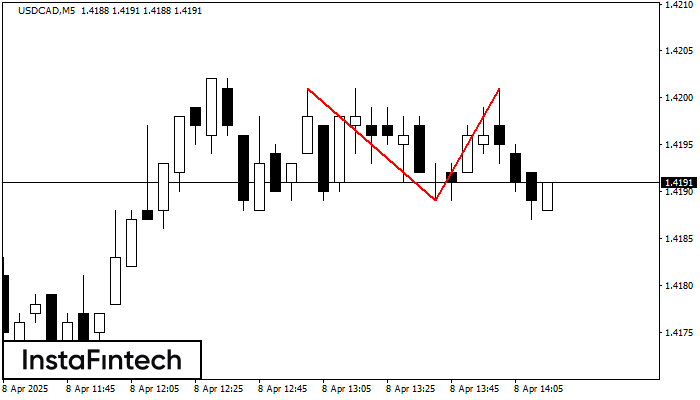
The Double Top reversal pattern has been formed on USDCAD M5. Characteristics: the upper boundary 1.4201; the lower boundary 1.4189; the width of the pattern is 12 points. Sell trades
The M5 and M15 time frames may have more false entry points.
Open chart in a new window