อ่านรายละเอียดเพิ่มเติม
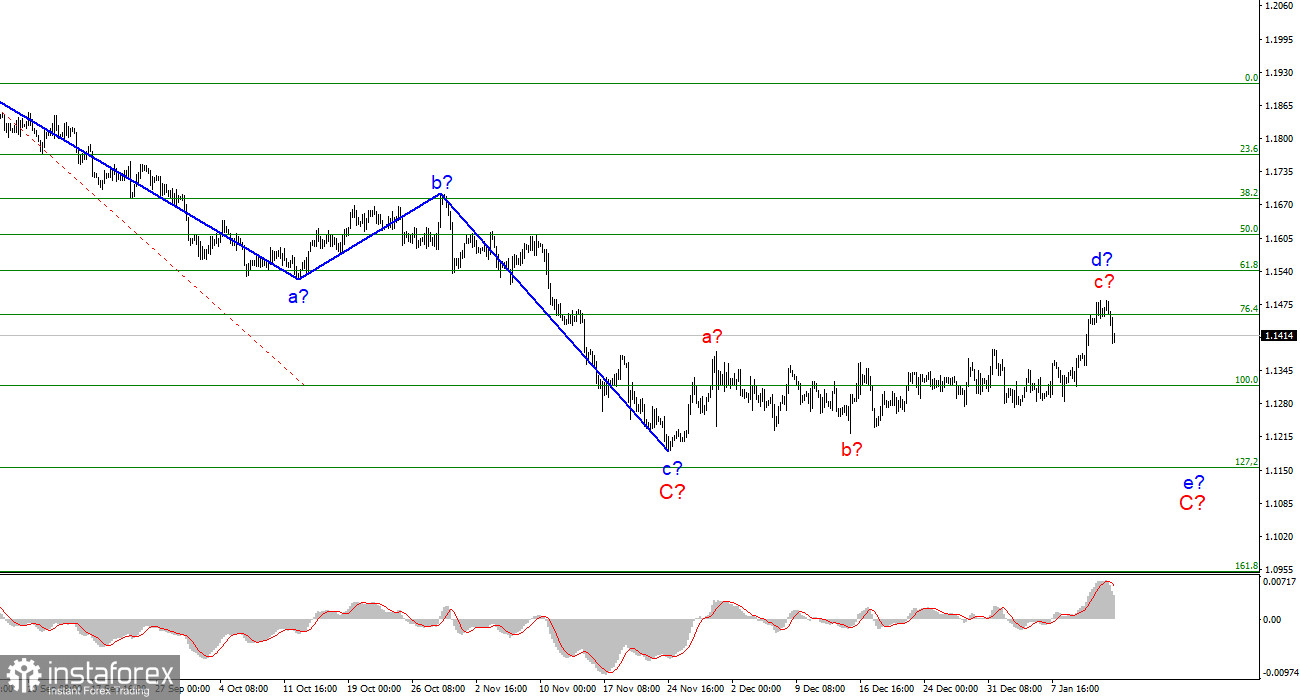
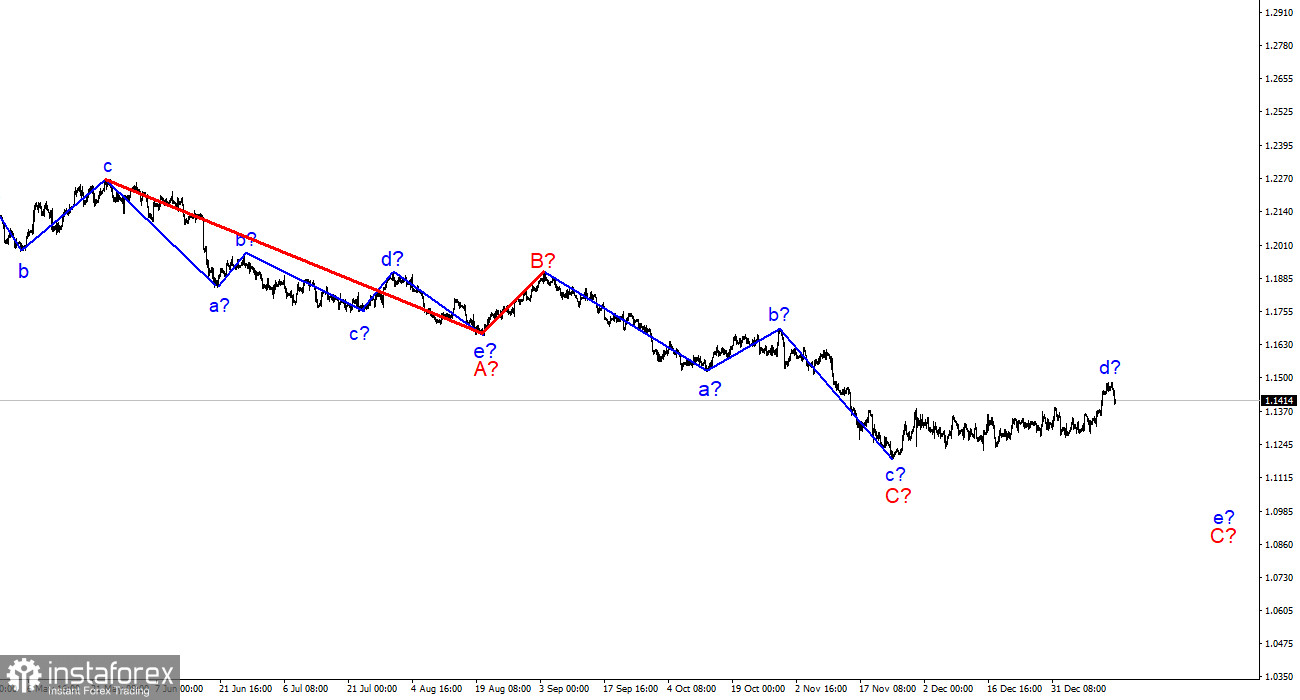
The wave marking of the 4-hour chart for the euro/dollar instrument still does not change. Over the past few days this week, the quotes of the instrument have been rising and have broken through the previous peak of the expected wave d. Thus, wave d turned out to be more extended than I originally expected. However, this change does not change the essence of the wave markup. I still believe that the current wave is corrective, not impulsive, as evidenced by its complex internal wave structure. Therefore, it cannot be wave 1 of a new upward trend segment. If so, the decline in quotes will resume within the framework of the expected wave e-C and Friday's departure of quotes from the reached highs may indirectly indicate the construction of a new downward wave. At the same time, a further increase in the quotes of the European currency may lead to the need to make adjustments to the current wave markup, since wave d will turn out in this case to be the longest wave in the composition of the downward trend section. An unsuccessful attempt to break through the 1.1455 mark also indicates that the market is not ready for further purchases of the instrument.
American inflation continues to accelerate.
The euro/dollar instrument fell by 50 basis points on Friday. Demand for the European currency began to decline, which corresponds to the current wave marking but does not correspond to Friday's news background. Christine Lagarde said on Friday that the ECB is ready to adjust monetary policy to reach the inflation target of about 2%. "We understand that the rise in prices worries the residents of the European Union. Our commitment to the goal of price stability remains unwavering, and we will take all necessary measures to stabilize price growth," the ECB president said. This speech was quite neutral since Lagarde did not say anything about raising the interest rate or ending the stimulus program. According to earlier information, it follows that the emergency asset purchase program will be completed in March 2022, but there is no new information about this. It is completely unknown what impact the winter wave of the pandemic will leave on the economy. Let me remind you that in the European Union, up to 50% of the population may become infected in the coming months. That's what the WHO thinks. With such a huge number of patients, it is unlikely that the economy will not suffer in any way. And if it suffers, the plans of the ECB may change. Also on Friday, a report on retail trade with America in December was released. The figures turned out to be sad. Instead of zero sales growth, the markets saw a decrease in volumes by 1.9% m/m. The report on industrial production was no better, it decreased by 0.1% m/m with market expectations of +0.2% m/m. The consumer sentiment index from the University of Michigan also turned out to be weak: only 68.8 with expectations of 70.0. Thus, all the most important reports in America turned out to be weak, but demand for the US currency still rose on Friday. From my point of view, this is evidence that the market is ready to build a downward wave, despite the weak news from the United States.
General conclusions.
Based on the analysis, I conclude that the construction of the ascending wave d can be completed. If this assumption is correct, then now it is possible to sell the instrument based on the construction of the wave e-C with targets located near the calculated marks of 1.1315 and 1.1154, which equates to 100.0% and 127.2% by Fibonacci. A successful attempt to break through the 1.1455 mark will indicate an even greater complication of the upward wave and cancel the sales option.
You have already liked this post today
*บทวิเคราะห์ในตลาดที่มีการโพสต์ตรงนี้ เพียงเพื่อทำให้คุณทราบถึงข้อมูล ไม่ได้เป็นการเจาะจงถึงขั้นตอนให้คุณทำการซื้อขายตาม
รูปแบบของคลื่นในกราฟ 4 ชั่วโมงของ EUR/USD ได้เปลี่ยนไปเป็นรูปแบบขาขึ้น สามารถกล่าวได้ว่าการเปลี่ยนแปลงนี้เกิดขึ้นอย่างสิ้นเชิงจากนโยบายการค้าของสหรัฐฯ ที่มีการเปลี่ยนแปลงใหม่ ก่อนถึงวันที่ 28 กุมภาพันธ์ ซึ่งเป็นวันที่ดอลลาร์เริ่มลดลงอย่างหนัก รูปแบบคลื่นทั้งหมดนั้นดูเหมือนเป็นส่วนของแนวโน้มขาลงที่แข็งแกร่ง กำลังอยู่ในกระบวนการของคลื่นแก้ไขที่ 2 อย่างไรก็ตาม
รูปแบบคลื่นในกราฟ GBP/USD ได้เปลี่ยนไปเป็นโครงสร้างขาขึ้นแบบแรงกระตุ้น—"ขอบคุณ" Donald Trump ภาพคลื่นนี้คล้ายคลึงกับคู่ EUR/USD มาก จนถึงวันที่ 28 กุมภาพันธ์ เราสังเกตเห็นการก่อตัวของโครงสร้างการแก้ไขที่แข็งแกร่งซึ่งไม่น่ากังวล อย่างไรก็ตาม ความต้องการดอลลาร์สหรัฐเริ่มลดลงอย่างรวดเร็ว จึงเกิดโครงสร้างขาขึ้น
รูปแบบคลื่นสำหรับ GBP/USD ได้เปลี่ยนเป็นโครงสร้างขาขึ้นแบบแรงกระตุ้นแล้ว—"ขอบคุณ" Donald Trump โครงสร้างคลื่นเกือบจะเหมือนกับ EUR/USD อย่างไม่มีข้อสงสัยใดๆ จนถึงวันที่ 28 กุมภาพันธ์ เราได้สังเกตการเกิดรูปแบบการปรับตัวที่น่าเชื่อถือ แต่หลังจากนั้นความต้องการสกุลเงินสหรัฐฯ ก็เริ่มลดลงอย่างรวดเร็ว นำไปสู่การพัฒนาของโครงสร้างคลื่นห้าขึ้น
รูปแบบคลื่นในกราฟ 4 ชั่วโมงของ EUR/USD ได้เปลี่ยนเป็นโครงสร้างที่มีแรงกระตุ้นขึ้น ฉันเชื่อว่าไม่มีข้อสงสัยใดๆ ว่าการเปลี่ยนแปลงนี้เกิดขึ้นเพียงเพราะนโยบายการค้าใหม่ของสหรัฐฯ ก่อนวันที่ 28 กุมภาพันธ์ เมื่อการลดลงของดอลลาร์สหรัฐฯ เริ่มขึ้น รูปแบบคลื่นแสดงให้เห็นถึงแนวโน้มขาลงที่น่าเชื่อถือ โดยเป็นการสร้างคลื่นปรับฐาน
โครงสร้างคลื่นในกราฟ 4 ชั่วโมงสำหรับคู่เงิน EUR/USD ได้เปลี่ยนไปเป็นรูปแบบคลื่นขาขึ้นแบบแรงกระตุ้น ฉันเชื่อว่าไม่มีใครสงสัยว่าการเปลี่ยนแปลงนี้เกิดขึ้นเพียงเพราะนโยบายการค้าใหม่ของสหรัฐอเมริกา ก่อนวันที่ 28 กุมภาพันธ์ เมื่อเงินดอลลาร์ของสหรัฐฯ เริ่มลดลงอย่างรวดเร็ว โครงสร้างคลื่นทั้งหมดดูเหมือนแนวโน้มขาลงที่แข็งแกร่ง — ก่อตัวเป็นคลื่นปรับตัว
โครงสร้างคลื่นในกราฟ GBP/USD ก็เปลี่ยนไปในรูปแบบบูลลิชและมีแรงกระตุ้นจาก "ผลจาก" Donald Trump เช่นเดียวกัน รูปแบบคลื่นนี้เกือบจะเหมือนกับ EUR/USD จนถึงวันที่ 28 กุมภาพันธ์ เราสังเกตเห็นการพัฒนาของโครงสร้างการปรับเปลี่ยนที่น่าเชื่อถือซึ่งไม่มีความกังวลใด ๆ อย่างไรก็ตาม
รูปแบบคลื่นในกราฟ GBP/USD ยังได้แปรเปลี่ยนเป็นโครงสร้างเชิงบวกที่แรงเกินคาด — อย่างไรก็ตาม "ขอบคุณ" โดนัลด์ ทรัมป ซึ่งรูปแบบคลื่นแทบจะเหมือนกับคู่เงิน EUR/USD โดยถึงวันที่ 28 กุมภาพันธ์ เราสังเกตเห็นการเกิดโครงสร้างแก้ไขที่แน่นหนาซึ่งไม่มีปัญหา แต่หลังจากนั้น
โครงสร้างคลื่นบนกราฟ 4 ชั่วโมงสำหรับคู่เงิน EUR/USD ได้เปลี่ยนไปสู่รูปแบบที่เป็นบวก ฉันเชื่อว่าไม่มีข้อกังขาใดที่การเปลี่ยนแปลงนี้เกิดขึ้นได้เนื่องจากนโยบายการค้าของสหรัฐฯ ที่ใหม่เท่านั้น ก่อนวันที่ 28 กุมภาพันธ์ เมื่อการลดลงอย่างรวดเร็วของดอลลาร์สหรัฐเริ่มขึ้น โครงสร้างคลื่นทั้งหมดดูเหมือนเป็นแนวโน้มขาลงที่ชัดเจน คลื่นที่ 2 ของโครงสร้างการแก้ไขกำลังก่อตัว
โครงสร้างคลื่นสำหรับ GBP/USD ก็ได้เปลี่ยนแปลงเป็นรูปแบบที่เพิ่มสูงขึ้น (bullish) ด้วยความอนุเคราะห์จาก Donald Trump โดยภาพคลื่นนั้นแทบจะเหมือนกับ EUR/USD อย่างมาก จนถึงวันที่ 28 กุมภาพันธ์ เราได้เฝ้าสังเกตการก่อตัวของโครงสร้างที่แก้ไขที่น่าเชื่อถือซึ่งไม่ทำให้กังวล อย่างไรก็ตาม
GBP/USD การวิเคราะห์: ตั้งแต่ต้นปีนี้ GBP/USD ได้มีการเคลื่อนตัวในคลื่นขาขึ้นบนกราฟรายวัน ขณะนี้คู่สกุลเงินได้มาถึงขอบเขตของโซนพลิกกลับที่เป็นไปได้ เมื่อทำการวิเคราะห์ราคาอยู่ใกล้กับพื้นที่ต้านทานที่คำนวณไว้ การพยากรณ์: ในอีกไม่กี่วันข้างหน้า คาดว่าจะมีแรงกดดันต่อโซนต้านทาน การพลิกกลับและการเริ่มเคลื่อนไหวขาลงอาจตามมา หากแนวโน้มเปลี่ยนแปลง อาจเกิดการทะลุระดับต้านทานเป็นระยะเวลาสั้น ขอบล่างของช่วงคาดการณ์รายสัปดาห์จะถูกกำหนดโดยการสนับสนุนที่คำนวณไว้ โซนกลับตัวที่อาจเกิดขึ้น
อีเมล/SMS
การแจ้งเตือน
Your IP address shows that you are currently located in the USA. If you are a resident of the United States, you are prohibited from using the services of InstaFintech Group including online trading, online transfers, deposit/withdrawal of funds, etc.
If you think you are seeing this message by mistake and your location is not the US, kindly proceed to the website. Otherwise, you must leave the website in order to comply with government restrictions.
Why does your IP address show your location as the USA?
Please confirm whether you are a US resident or not by clicking the relevant button below. If you choose the wrong option, being a US resident, you will not be able to open an account with InstaTrade anyway.
We are sorry for any inconvenience caused by this message.