อ่านรายละเอียดเพิ่มเติม


 04.11.2021 04:54 AM
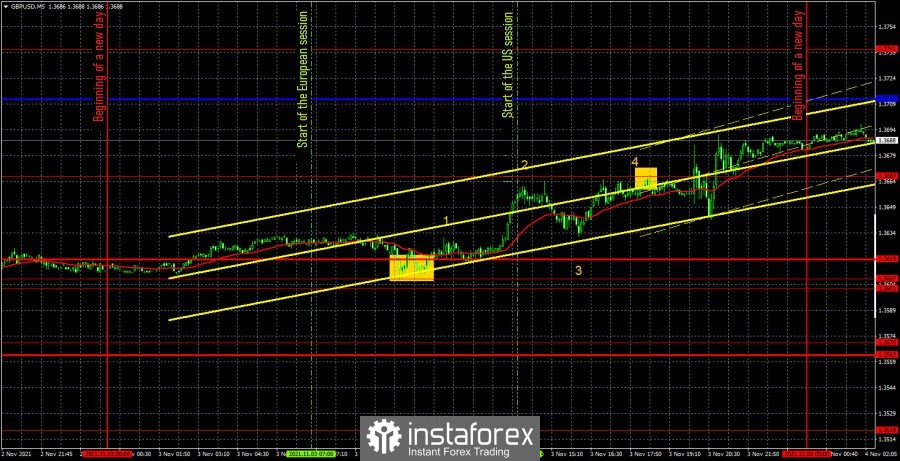
GBP/USD 5M
The GBP/USD pair traded rather sluggishly on November 3. The volatility of the environment was up to the moment of publication of the results of the Federal Reserve meeting, which is very little for the pound. And this despite the fact that there were quite important macroeconomic publications in the US during the day, and Bank of England Governor Andrew Bailey made a speech in the UK. However, the markets did not find it necessary to process this information. As we can see in the chart above, only the ISM service business activity index could theoretically influence the pair's movement, since it was at this time (the number "3" in the chart) that the direction of movement changed. However, the problem is that the ISM index turned out to be more positive than the analysts' forecasts, and rose to 66.7 points in October. Thus, after its publication, the dollar was supposed to rise in price, not fall in price. All other events of the day did not cause any reaction from the markets at all. The number "1" - business activity in the UK services sector. The number "2" is the US ADP report. Number "4" - Bailey's speech. As a result, it remains for us to consider only trading signals that were formed during the day and remind that we do not recommend considering signals in the evening, since lower timeframes involve intraday trading. Consequently, before the evening FOMC results were published and the press conference with Jerome Powell. Traders should have already left the market anyway. However, they did just that if they followed our recommendations. During the day, only one buy signal was generated when the price bounced off the 1.3607 level. After that, the pair went up about 40 points and stopped near the extremum level of 1.3667, from which it rebounded with an error of 1 point. It was at this moment that long positions should have been closed in a profit of about 30 points. Thus, despite the strong "foundation" and "macroeconomics", only one signal was formed, which made it possible to earn, despite the weak volatility.
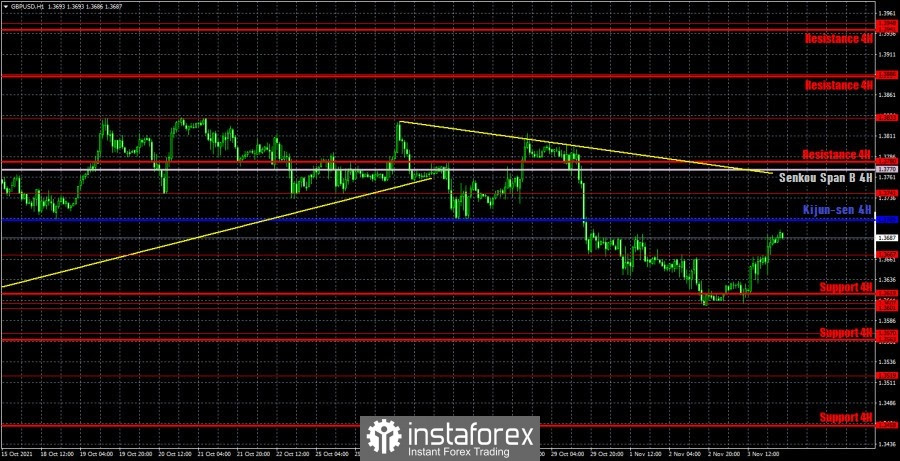
GBP/USD 1H
On the hourly timeframe, the pound/dollar pair is trying with all its might to continue the downward movement and even formed a downward trend line, which, however, it has a very small slope and is therefore, weak. However, the very movement of the pair in recent days is also not distinguished by special strength. So far, the downward trend continues, but it practically does not limit the pair in a possible upward movement. On November 4, we distinguish the following important levels: 1.3519, 1.3570, 1.3601 - 1.3607, 1.3667, 1.3741. Senkou Span B (1.3770) and Kijun-sen (1.3709) lines can also be signal sources. It is recommended to set the Stop Loss level at breakeven when the price passes in the right direction by 20 points. The Ichimoku indicator lines can move during the day, which should be taken into account when looking for trading signals. The results of the Bank of England meeting will be summed up in the UK on Thursday. And this is undoubtedly the most important event of the day. Everything will depend on whether important decisions are made by the British central bank, or whether at least its rhetoric changes in a slightly more hawkish direction? If not, then the markets may not react in any way to this event. We also have Bailey's speech today and a report on business activity for the construction sector. Thus, in general, the fundamental background may be strong today, but the market's reaction is unpredictable. You need to be prepared for any scenario.
We recommend you to familiarize yourself:
Overview of the EUR/USD pair. November 4. Macroeconomic statistics and Christine Lagarde's speech.
Overview of the GBP/USD pair. November 4. Ahead of the Bank of England meeting.
Forecast and trading signals for EUR/USD for November 4. Detailed analysis of the movement of the pair and trade deals.
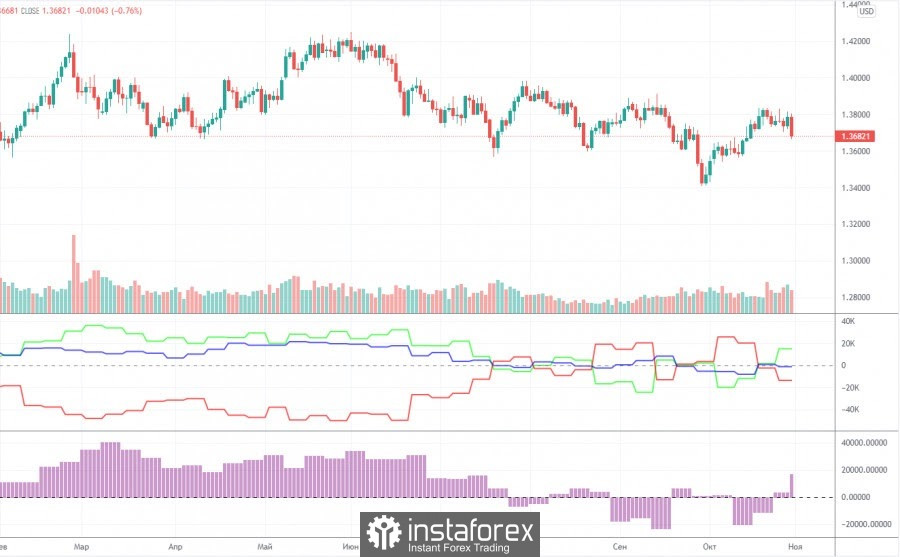
COT report
The mood of professional traders became more bullish during the last reporting week (October 19-25). The situation with the COT reports is now even more ambiguous than with the technical picture. And if we compare the COT reports for the euro and the pound, the situation becomes even stranger. Both indicators in the chart above show that the major players still do not have any clear, precise and understandable mood. Consequently, it simply does not make sense to make any forecasts based on COT reports now. The chart above clearly shows the pair's entire movement over the past six months. It is rather difficult to call it a trend or even a trend. The mood of the big players has been constantly changing in the last couple of months. The green and red lines of the first indicator (net positions of groups of traders "commercial" and "non-commercial") are constantly changing the direction of movement, constantly crossing the zero mark. This means that the two largest groups of traders are constantly increasing and decreasing their net positions. During the reporting week, professional traders opened 2.8 thousand buy contracts (longs) and closed 10.7 thousand sell contracts (shorts). Thus, their net position increased by 10,000 contracts. This is in line with what has been happening with the pound in recent weeks (it is growing). Nevertheless, it is impossible to make a long-term forecast, since the net position may fall already by the end of next week. Especially considering the fall of the pound itself on Friday.
Explanations for the chart:
Support and Resistance Levels are the levels that serve as targets when buying or selling the pair. You can place Take Profit near these levels.
Kijun-sen and Senkou Span B lines are lines of the Ichimoku indicator transferred to the hourly timeframe from the 4-hour one.
Support and resistance areas are areas from which the price has repeatedly rebounded off.
Yellow lines are trend lines, trend channels and any other technical patterns.
Indicator 1 on the COT charts is the size of the net position of each category of traders.
Indicator 2 on the COT charts is the size of the net position for the non-commercial group.
You have already liked this post today
*บทวิเคราะห์ในตลาดที่มีการโพสต์ตรงนี้ เพียงเพื่อทำให้คุณทราบถึงข้อมูล ไม่ได้เป็นการเจาะจงถึงขั้นตอนให้คุณทำการซื้อขายตาม
ในการพยากรณ์ของผมตอนเช้า ผมได้เน้นระดับที่ 1.2986 และวางแผนที่จะตัดสินใจเข้าสู่ตลาดจากจุดนั้น ลองดูกราฟ 5 นาทีและวิเคราะห์สิ่งที่เกิดขึ้น มีการลดลงและการทะลุเพียงชั่วคราวที่ระดับนั้น ซึ่งเป็นโอกาสในการซื้อปอนด์ ส่งผลให้ได้กำไรมากกว่า 100 จุด การเปิดตำแหน่ง Long
ในการพยากรณ์ช่วงเช้าของฉัน ฉันได้เน้นไปที่ระดับ 1.1336 และวางแผนการตัดสินใจเข้าสู่ตลาดตามระดับนี้ มาลองดูกราฟ 5 นาทีและวิเคราะห์สิ่งที่เกิดขึ้น การเบรคออกและการทดสอบอีกครั้งในช่วงนี้ได้ให้สัญญาณซื้อที่แข็งแกร่งสำหรับเงินยูโร ส่งผลให้แนวโน้มขาขึ้นที่สังเกตได้ตั้งแต่เมื่อวานยังคงดำเนินต่อไป ซึ่งส่งผลให้คู่สกุลเงินนี้เพิ่มขึ้นมากกว่า 100 จุด รูปทรงทางเทคนิคได้ถูกแก้ไขใหม่สำหรับครึ่งหลังของวัน การเปิดสถานะซื้อใน EUR/USD
ในช่วง 24 ชั่วโมงที่ผ่านมา คู่เงิน GBP/USD เคลื่อนไหวขึ้นไป 170 pip ตลอดทั้งคืนจนถึงเช้าวันศุกร์ ค่าเงินปอนด์ยังคงเพิ่มขึ้น หลายวันที่ผ่านมาเราได้สังเกตว่าดอลลาร์ได้แข็งค่าขึ้นอย่างมาก แต่ก็ได้บอกว่าเราไม่แปลกใจหากมันจะเริ่มอ่อนค่าอย่างรวดเร็วในไม่ช้า ดังที่เราเห็นแล้ว ภาษีใหม่ของ Trump
ในวันพฤหัสบดี คู่สกุลเงิน EUR/USD ได้กลับมาปรับตัวขึ้นอีกครั้งและสร้างกำไรมากกว่า 300 pip เมื่อวันศุกร์เริ่มต้น คู่สกุลเงินยังคงเติบโตอย่างต่อเนื่องไม่มีสะดุด เหตุผลเบื้องหลังการล่มสลายอีกครั้งของดอลลาร์สหรัฐสามารถระบุได้ไม่ยาก โดยโดนัลด์ ทรัมป์ ได้เพิ่มภาษีการค้าต่อจีนครั้งแรกที่ 125% และต่อมาเป็น 145%
ค่าเงิน EUR/USD แสดงถึงการเติบโตอย่างแข็งแกร่งในวันพฤหัสบดี ซึ่งน่าจะไม่ได้ทำให้ใครประหลาดใจ โดยเฉพาะเมื่อเรารายงานว่าภาษีศุลกากรกับจีนได้ถูกเพิ่มขึ้นถึง 125% ล่าสุดทรัมป์ได้เพิ่มขึ้นอีกเป็น 145% เท่านั้นไม่พอ ความไร้เหตุผลก็ดำเนินต่อไป ด้วยอัตราเช่นนี้ เราก็อาจจะได้เห็นภาษีศุลกากรที่สูงถึง 500% ภายในสิ้นเดือนตามที่เราทำนายครึ่งจริงครึ่งล้อเล่นเมื่อวานนี้ อย่างไรก็ตาม
ในการพยากรณ์ช่วงเช้าของฉัน ฉันเน้นไปที่ระดับ 1.2871 และวางแผนที่จะตัดสินใจเข้าตลาดจากระดับนี้ ลองมาดูที่แผนภูมิ 5 นาทีและดูว่าเกิดอะไรขึ้น การเพิ่มขึ้นและการทดสอบเกินจริงที่ระดับนั้นนำไปสู่จุดเข้าซื้อเพื่อขายสั้นของคำสั่งขายปอนด์ ซึ่งส่งผลให้คู่เงินลดลง 25 จุด มุมมองทางเทคนิคได้ถูกปรับแก้สำหรับช่วงครึ่งหลังของวัน กลยุทธ์การเปิดสถานะซื้อใน GBP/USD: ค่าเงินปอนด์ยังคงฟื้นตัวได้แม้ว่าจะไม่มีสถิติพื้นฐานสำคัญจากสหราชอาณาจักร
ในพยากรณ์ช่วงเช้าของฉัน ฉันได้เน้นไปที่ระดับ 1.1019 และวางแผนที่จะตัดสินใจเกี่ยวกับการเข้าตลาดโดยอิงจากจุดนี้ มาดูกราฟ 5 นาทีเพื่อตรวจสอบสิ่งที่เกิดขึ้นกัน ราคามีการปรับขึ้นจริง แต่ฉันไม่เห็นการทะลุที่ผิดพลาดในระดับดังกล่าว หรือการทดสอบซ้ำหลังจากการทะลุ ซึ่งส่งผลให้ไม่มีการทำการซื้อขายใดๆ รูปแบบทางเทคนิคจึงได้รับการแก้ไขใหม่สำหรับช่วงครึ่งหลังของวัน แม้ว่ายูโรจะเติบโตอย่างแข็งแกร่งจากการอภิปรายในสหภาพยุโรปเกี่ยวกับการยกเลิกภาษีที่เคยกำหนดต่อสหรัฐฯ ทุกอย่างอาจเปลี่ยนไปอย่างรวดเร็วในช่วงครึ่งหลังของวัน เราคาดหวังข้อมูลเกี่ยวกับดัชนีราคาผู้บริโภค
คู่ GBP/USD ในช่วง 24 ชั่วโมงที่ผ่านมาเคลื่อนไหวขึ้น ลง และขึ้นอีกครั้ง อย่างก่อนหน้านี้ ไม่สามารถระบุแนวโน้มที่ชัดเจนในกรอบเวลา 1 ชั่วโมงได้ ข่าวเกี่ยวกับความคืบหน้าของสงครามการค้าออกมาเกือบทุกชั่วโมงหรือทุกสองชั่วโมง ความเชื่อมั่นของตลาดเปลี่ยนแปลงตลอดเวลา คู่สกุลเงินนี้ถูกผลักดันให้ขึ้นลงอยู่ตลอด เวลานี้ค่าเงินปอนด์ก็กำลังขยับขึ้น
คู่สกุลเงิน EUR/USD มีการเติบโตและลดลงอย่างมากในวันพุธที่ผ่านมา เมื่อเร็ว ๆ นี้ การเคลื่อนไหวทั้งสองถูกกระตุ้นโดย Donald Trump เป็นส่วนใหญ่ ข่าวแรกที่ออกมาคือสหรัฐอเมริกาจะปรับเพิ่มภาษีต่อจีน ซึ่งทำให้ยอดภาษีรวมสูงขึ้นถึงระดับเกินกว่า 104% จากนั้น Trump
เมื่อวันพุธที่ผ่านมา คู่สกุลเงิน GBP/USD แสดงการเคลื่อนไหวที่ผสมผสานตลอดทั้งวัน แต่โดยทั่วไปยังคงเป็นแนวโน้มขาลง — หากเราสามารถเรียกพฤติกรรมปัจจุบันนี้ว่า "แนวโน้ม" ตอนกลางวันไม่มีพื้นฐานทางเศรษฐมหภาค แต่มีข่าวมากมายเกี่ยวกับสงครามการค้า สหภาพยุโรปอาจเริ่มเรียกเก็บภาษีนำเข้าจากสหรัฐที่อัตรา 25% ในสัปดาห์หน้า ขณะที่ในวันอังคารที่ผ่านมา จีนตอบโต้ทรัมป์ด้วยภาษี
สมาชิกInstaForex

Your IP address shows that you are currently located in the USA. If you are a resident of the United States, you are prohibited from using the services of InstaFintech Group including online trading, online transfers, deposit/withdrawal of funds, etc.
If you think you are seeing this message by mistake and your location is not the US, kindly proceed to the website. Otherwise, you must leave the website in order to comply with government restrictions.
Why does your IP address show your location as the USA?
Please confirm whether you are a US resident or not by clicking the relevant button below. If you choose the wrong option, being a US resident, you will not be able to open an account with InstaTrade anyway.
We are sorry for any inconvenience caused by this message.


