Patrones actuales

Los patrones son modelos gráficos que se forman en el gráfico mediante el precio. Según uno de los postulados del análisis técnico, la historia (movimiento del precio) se repite. Esto quiere decir que los movimientos del precio a menudo son similares en las mismas situaciones que hacen posible pronosticar el futuro desarrollo de la situación con una alta probabilidad.
Los patrones relevantes de InstaTrade son un servicio fácil de utilizar que permiten que conozca los últimos cambios en el mercado y reaccione a las pistas del mercado a tiempo. En nuestro servicio, siempre encontrará los últimos y más importantes patrones en cualquier par y en cualquier marco de tiempo.
Bullish Symmetrical Triangle
was formed on 14.04 at 04:00:58 (UTC+0)
signal strength 4 of 5

According to the chart of H1, EURNZD formed the Bullish Symmetrical Triangle pattern. Description: This is the pattern of a trend continuation. 2.0005 and 1.9118 are the coordinates of the upper and lower borders respectively. The pattern width is measured on the chart at 887 pips. Outlook: If the upper border 2.0005 is broken, the price is likely to continue its move by 1.9525.
- All
- All
- Bearish Rectangle
- Bearish Symmetrical Triangle
- Bearish Symmetrical Triangle
- Bullish Rectangle
- Double Top
- Double Top
- Triple Bottom
- Triple Bottom
- Triple Top
- Triple Top
- All
- All
- Buy
- Sale
- All
- 1
- 2
- 3
- 4
- 5
डबल टॉप
was formed on 21.04 at 05:30:19 (UTC+0)
signal strength 1 of 5
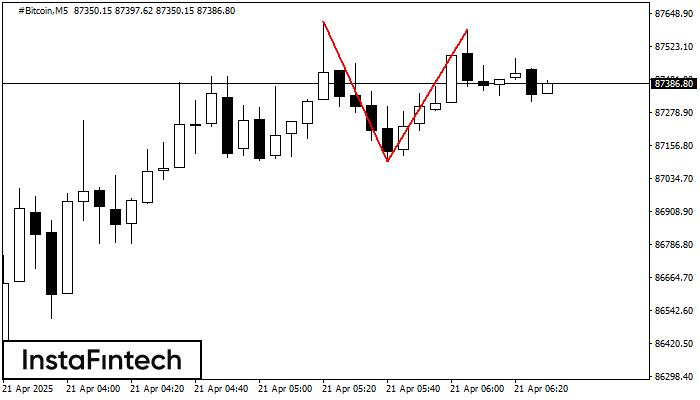
#Bitcoin M5 पर डबल टॉप रीवर्सल पैटर्न बना है। विशेषताएं: ऊपरी सीमा 87617.56; निचली सीमा 87098.24; पैटर्न की चौड़ाई 48893 पॉइंट्स है। सेल ट्रेडों को 87098.24 की निचली सीमा के
M5 और M15 समय सीमा में अधिक फाल्स एंट्री पॉइंट्स हो सकते हैं।
Open chart in a new window
बुलिश सिमेट्रिकल त्रिभुज
was formed on 21.04 at 04:56:25 (UTC+0)
signal strength 1 of 5

M5 के चार्ट के अनुसार, AUDCAD से बुलिश सिमेट्रिकल त्रिभुज पैटर्न बना, जो दर्शाता है कि ट्रेंड जारी रहेगा। विवरण: पैटर्न की ऊपरी सीमा निर्देशांक 0.8838/0.8828 को स्पर्श करती है
M5 और M15 समय सीमा में अधिक फाल्स एंट्री पॉइंट्स हो सकते हैं।
Open chart in a new window
बुलिश पताका
was formed on 21.04 at 04:53:32 (UTC+0)
signal strength 1 of 5

बुलिश पताका ग्राफ़िक पैटर्न GBPAUD M5 इंस्ट्रूमेंट पर बना है। यह निरंतरता पैटर्न की श्रेणी में आता है। इस मामले में, यदि भाव उच्च स्तर पर टूटता है, तो इसके
M5 और M15 समय सीमा में अधिक फाल्स एंट्री पॉइंट्स हो सकते हैं।
Open chart in a new window