Patrones actuales

Los patrones son modelos gráficos que se forman en el gráfico mediante el precio. Según uno de los postulados del análisis técnico, la historia (movimiento del precio) se repite. Esto quiere decir que los movimientos del precio a menudo son similares en las mismas situaciones que hacen posible pronosticar el futuro desarrollo de la situación con una alta probabilidad.
Los patrones relevantes de InstaTrade son un servicio fácil de utilizar que permiten que conozca los últimos cambios en el mercado y reaccione a las pistas del mercado a tiempo. En nuestro servicio, siempre encontrará los últimos y más importantes patrones en cualquier par y en cualquier marco de tiempo.
Double Top
was formed on 02.04 at 04:20:22 (UTC+0)
signal strength 1 of 5
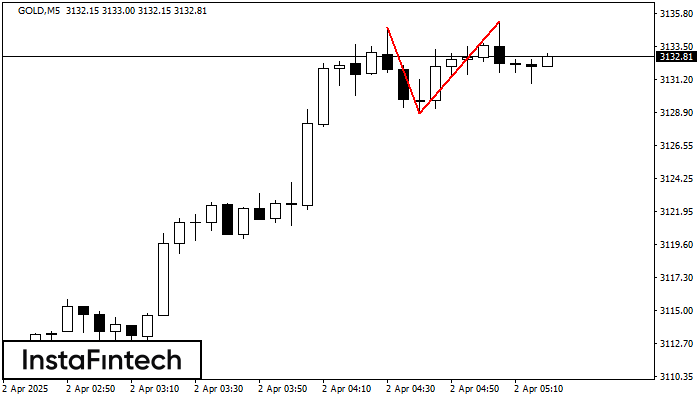
On the chart of GOLD M5 the Double Top reversal pattern has been formed. Characteristics: the upper boundary 3135.25; the lower boundary 3128.79; the width of the pattern 646 points. The signal: a break of the lower boundary will cause continuation of the downward trend targeting the 3128.64 level.
The M5 and M15 time frames may have more false entry points.
Vea asimismo
- All
- All
- Bearish Rectangle
- Bearish Symmetrical Triangle
- Bearish Symmetrical Triangle
- Bullish Rectangle
- Double Top
- Double Top
- Triple Bottom
- Triple Bottom
- Triple Top
- Triple Top
- All
- All
- Buy
- Sale
- All
- 1
- 2
- 3
- 4
- 5
Banderín alcista
was formed on 11.04 at 01:52:34 (UTC+0)
signal strength 3 of 5
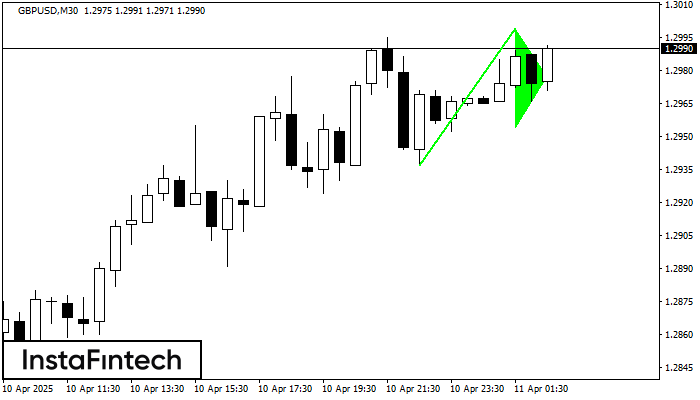
La señal Banderín alcista – Instrumento de negociación GBPUSD M30, patrón de continuación. Pronóstico: es posible establecer una posición de compra por encima del alza del patrón de 1.2999
Open chart in a new window
Doble Techo
was formed on 11.04 at 01:15:28 (UTC+0)
signal strength 1 of 5
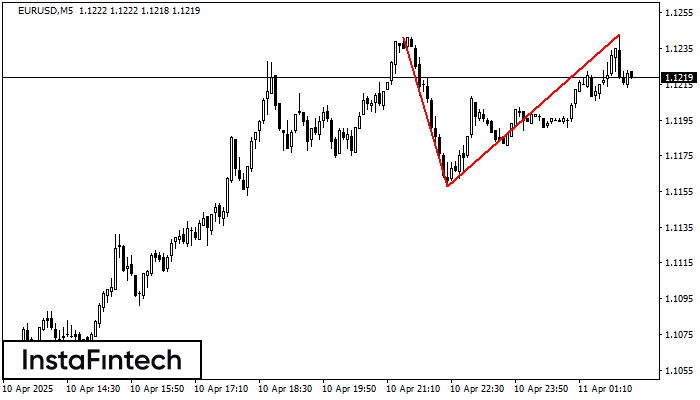
El patrón Doble Techo ha sido formado en EURUSD M5. Esto señala que la tendencia ha sido cambiada de alcista a bajista. Probablemente, si la base del patrón 1.1158
Los marcos de tiempo M5 y M15 pueden tener más puntos de entrada falsos.
Open chart in a new window
Rectángulo Bajista
was formed on 11.04 at 00:33:35 (UTC+0)
signal strength 1 of 5
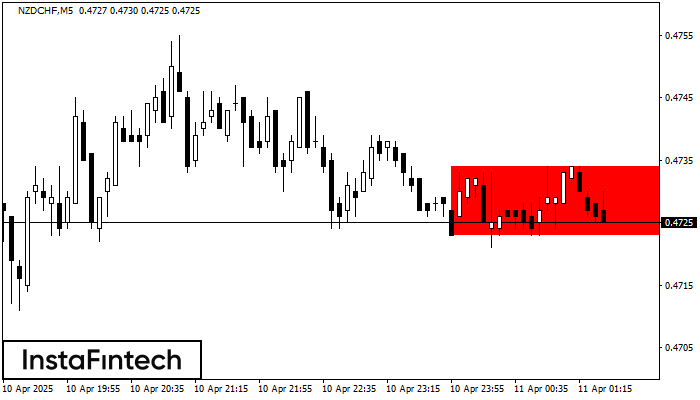
Según el gráfico de M5, NZDCHF formó el Rectángulo Bajista. Este tipo de patrón indica la continuación de una tendencia. Esto consiste de dos niveles: resistencia 0.4734 - 0.0000
Los marcos de tiempo M5 y M15 pueden tener más puntos de entrada falsos.
Open chart in a new window