Patrones actuales

Los patrones son modelos gráficos que se forman en el gráfico mediante el precio. Según uno de los postulados del análisis técnico, la historia (movimiento del precio) se repite. Esto quiere decir que los movimientos del precio a menudo son similares en las mismas situaciones que hacen posible pronosticar el futuro desarrollo de la situación con una alta probabilidad.
Los patrones relevantes de InstaTrade son un servicio fácil de utilizar que permiten que conozca los últimos cambios en el mercado y reaccione a las pistas del mercado a tiempo. En nuestro servicio, siempre encontrará los últimos y más importantes patrones en cualquier par y en cualquier marco de tiempo.
Bearish pennant
was formed on 31.03 at 15:25:22 (UTC+0)
signal strength 1 of 5
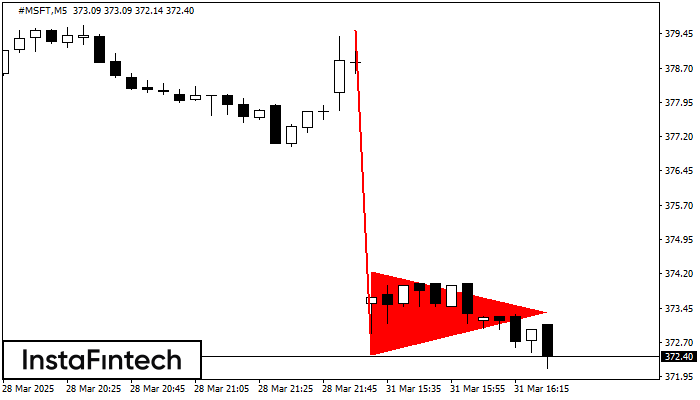
The Bearish pennant pattern has formed on the #MSFT M5 chart. The pattern signals continuation of the downtrend in case the pennant’s low of 372.44 is broken through. Recommendations: Place the sell stop pending order 10 pips below the pattern’s low. Place the take profit order at the projection distance of the flagpole height.
The M5 and M15 time frames may have more false entry points.
- All
- All
- Bearish Rectangle
- Bearish Symmetrical Triangle
- Bearish Symmetrical Triangle
- Bullish Rectangle
- Double Top
- Double Top
- Triple Bottom
- Triple Bottom
- Triple Top
- Triple Top
- All
- All
- Buy
- Sale
- All
- 1
- 2
- 3
- 4
- 5
Triángulo Simétrico Bajista
was formed on 21.04 at 12:20:58 (UTC+0)
signal strength 1 of 5

Según el gráfico de M5, el GBPCHF formó el patrón Triángulo Simétrico Bajista. Recomendaciones de negociación: es posible que una ruptura del límite inferior 1.0783 fomente una continuación
Los marcos de tiempo M5 y M15 pueden tener más puntos de entrada falsos.
Open chart in a new window
Triple Piso
was formed on 21.04 at 12:15:45 (UTC+0)
signal strength 2 of 5

El patrón Triple Piso ha sido formado en el gráfico de USDJPY M15. Características del patrón: línea inferior del patrón tiene coordenadas 140.99 con el límite superior 140.99/140.92, la proyección
Los marcos de tiempo M5 y M15 pueden tener más puntos de entrada falsos.
Open chart in a new window
Rectángulo Alcista
was formed on 21.04 at 12:13:34 (UTC+0)
signal strength 1 of 5
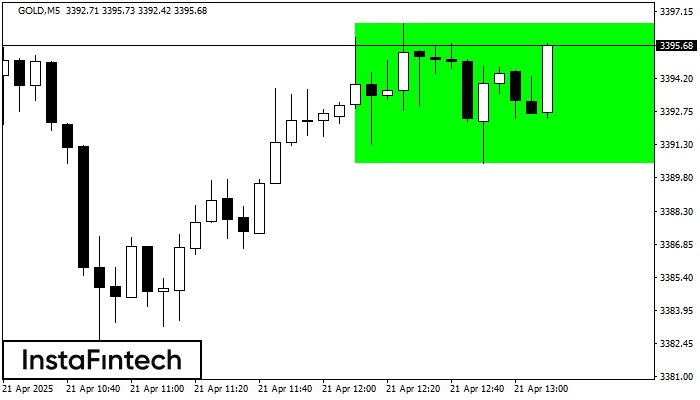
Según el gráfico de M5, GOLD formó el Rectángulo Alcista. Este tipo de patrón indica la continuación de una tendencia. Esto consiste de dos niveles: resistencia 3396.64 y soporte 3390.42
Los marcos de tiempo M5 y M15 pueden tener más puntos de entrada falsos.
Open chart in a new window