Vea también


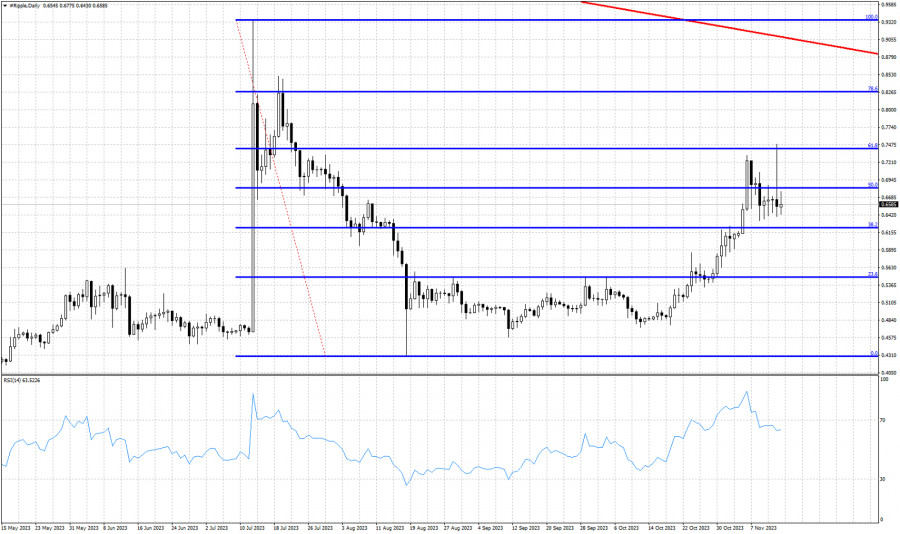
Blue lines- Fibonacci retracement levels
Red line- major resistance trend line
XRPUSD is trading around $0.65. Yesterday price formed a new higher high but it was shortlived. Price reached $0.7484 but failed to close on the positive side. On the contrary price pulled back and closed in negative territory. The Daily candlestick formed another long upper tail suggesting weakness and inability by bulls to maintain their gains. The new high touched the 61.8% retracement resistance and got rejected. Price closed yesterday around $0.6550. Each time XRPUSD reached $0.74-$0.75 area sellers dominate and push price lower. The new higher high in price was not followed by a higher high in the RSI. The RSI formed a bearish divergence and is turning lower from overbought levels. Short-term support is at $0.6330 and a break below this level will be the signal for the start of the pull back.
You have already liked this post today
*El análisis de mercado publicado aquí tiene la finalidad de incrementar su conocimiento, más no darle instrucciones para realizar una operación.


Video de entrenamiento

Your IP address shows that you are currently located in the USA. If you are a resident of the United States, you are prohibited from using the services of InstaFintech Group including online trading, online transfers, deposit/withdrawal of funds, etc.
If you think you are seeing this message by mistake and your location is not the US, kindly proceed to the website. Otherwise, you must leave the website in order to comply with government restrictions.
Why does your IP address show your location as the USA?
Please confirm whether you are a US resident or not by clicking the relevant button below. If you choose the wrong option, being a US resident, you will not be able to open an account with InstaTrade anyway.
We are sorry for any inconvenience caused by this message.

