Actual patterns

Patterns are graphical models which are formed in the chart by the price. According to one of the technical analysis postulates, history (price movement) repeats itself. It means that the price movements are often similar in the same situations which makes it possible to predict the further development of the situation with a high probability.
Relevant patterns by InstaTrade is an easy-to-use service which allows you to be aware of latest changes in the market and react to clues from the market in time. In our service you will always find the latest and most relevant patterns on any pair and any timeframe.
Actual Patterns
- All
- All
- Bearish Rectangle
- Bearish Symmetrical Triangle
- Bearish Symmetrical Triangle
- Bullish Rectangle
- Double Top
- Double Top
- Triple Bottom
- Triple Bottom
- Triple Top
- Triple Top
- All
- All
- Buy
- Sale
- All
- 1
- 2
- 3
- 4
- 5
Doble Piso
was formed on 16.04 at 23:26:06 (UTC+0)
signal strength 1 of 5
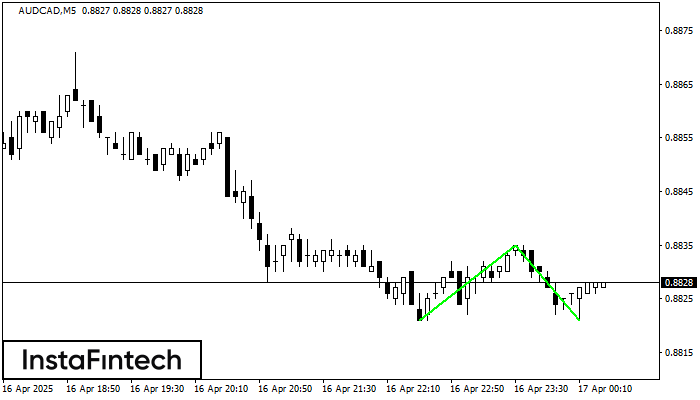
El patrón Doble Piso ha sido formado en AUDCAD M5; el límite superior es 0.8835; el límite inferior es 0.8821. El ancho del patrón es 14 puntos. En caso
Los marcos de tiempo M5 y M15 pueden tener más puntos de entrada falsos.
Open chart in a new window
Doble Piso
was formed on 16.04 at 22:45:07 (UTC+0)
signal strength 1 of 5
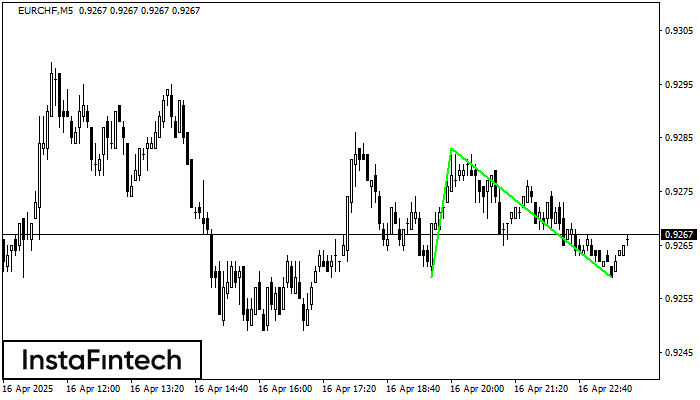
El patrón Doble Piso ha sido formado en EURCHF M5; el límite superior es 0.9283; el límite inferior es 0.9259. El ancho del patrón es 24 puntos. En caso
Los marcos de tiempo M5 y M15 pueden tener más puntos de entrada falsos.
Open chart in a new window
Doble Techo
was formed on 16.04 at 20:30:32 (UTC+0)
signal strength 4 of 5

En el gráfico de #KO H1 el patrón de reversión Doble Techo ha sido formado. Características: límite superior 72.67; límite inferior 71.72; el ancho del patrón 95 puntos. La señal
Open chart in a new window
Triple Techo
was formed on 16.04 at 20:30:06 (UTC+0)
signal strength 4 of 5

En el gráfico del instrumento de negociación #MA H1, se ha formado el patrón Triple Techo que señala un cambio en la tendencia. Es posible que después de la formación
Open chart in a new window
Triple Techo
was formed on 16.04 at 20:00:08 (UTC+0)
signal strength 3 of 5

El patrón Triple Techo ha sido formado en el gráfico de #MA M30. Características del patrón: los límites tienen un ángulo ascendente, la línea inferior del patrón tiene coordenadas 508.17/512.83
Open chart in a new window
Doble Piso
was formed on 16.04 at 19:45:07 (UTC+0)
signal strength 2 of 5
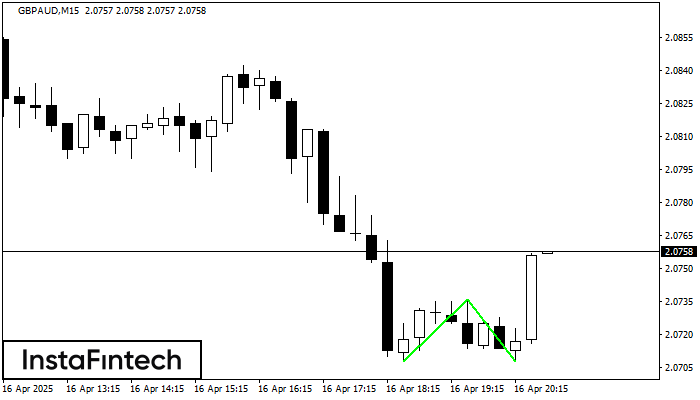
El patrón Doble Piso ha sido formado en GBPAUD M15; el límite superior es 2.0736; el límite inferior es 2.0708. El ancho del patrón es 28 puntos. En caso
Los marcos de tiempo M5 y M15 pueden tener más puntos de entrada falsos.
Open chart in a new window
Doble Piso
was formed on 16.04 at 19:30:25 (UTC+0)
signal strength 1 of 5
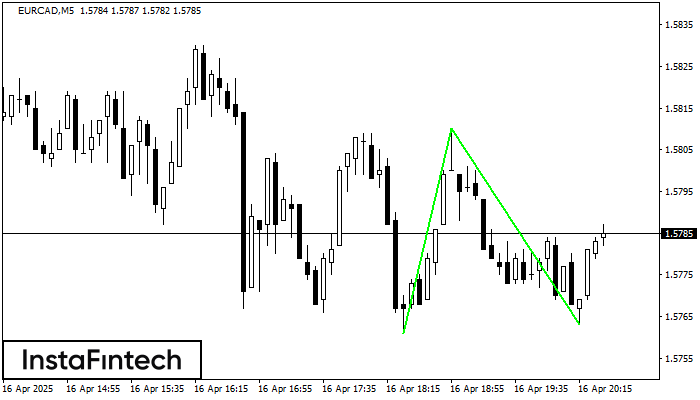
El patrón Doble Piso ha sido formado en EURCAD M5; el límite superior es 1.5810; el límite inferior es 1.5763. El ancho del patrón es 49 puntos. En caso
Los marcos de tiempo M5 y M15 pueden tener más puntos de entrada falsos.
Open chart in a new window
Doble Piso
was formed on 16.04 at 19:30:16 (UTC+0)
signal strength 2 of 5

El patrón Doble Piso ha sido formado en EURCAD M15. Características: el nivel de soporte 1.5761; el nivel de resistencia 1.5810; el ancho del patrón 49 puntos. Si el nivel
Los marcos de tiempo M5 y M15 pueden tener más puntos de entrada falsos.
Open chart in a new window
Doble Techo
was formed on 16.04 at 19:30:13 (UTC+0)
signal strength 3 of 5
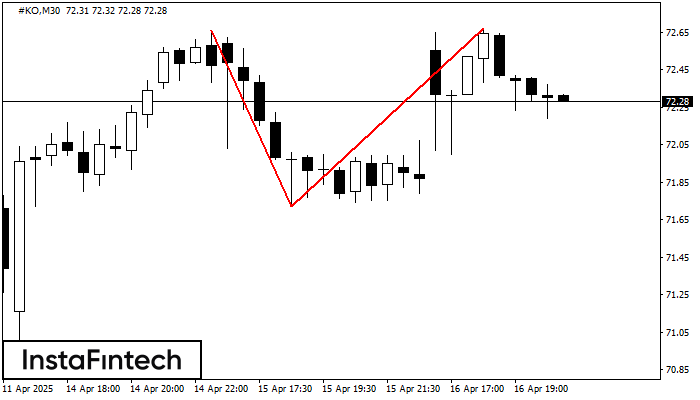
El patrón Doble Techo ha sido formado en #KO M30. Esto señala que la tendencia ha sido cambiada de alcista a bajista. Probablemente, si la base del patrón 71.72
Open chart in a new window