Padrões atuais

Padrões são modelos gráficos que são formados no gráfico pelo preço. Segundo um dos postulados da análise técnica, a história (movimento de preços) se repete. Isso significa que os movimentos de preços geralmente são semelhantes nas mesmas situações, o que possibilita prever o desenvolvimento futuro da situação com alta probabilidade.
Os padrões relevantes da InstaTrade são um serviço fácil de usar, que permite que você esteja ciente das últimas mudanças no mercado e reaja a indícios do mercado a tempo. Em nosso serviço, você sempre encontrará os padrões mais recentes e relevantes em qualquer par e em qualquer período gráfico.
Double Bottom
was formed on 15.04 at 21:15:27 (UTC+0)
signal strength 2 of 5
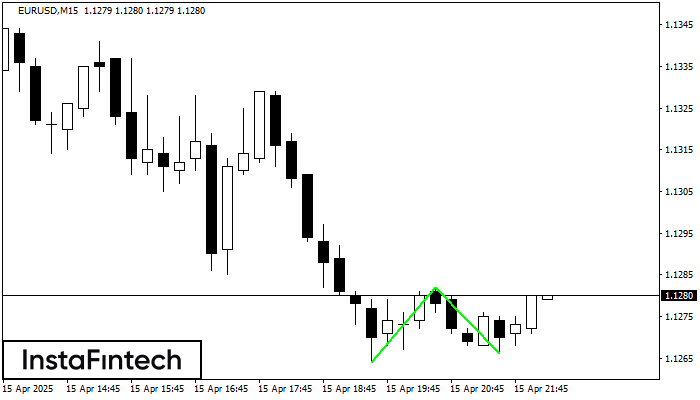
The Double Bottom pattern has been formed on EURUSD M15. Characteristics: the support level 1.1264; the resistance level 1.1282; the width of the pattern 18 points. If the resistance level is broken, a change in the trend can be predicted with the first target point lying at the distance of 16 points.
The M5 and M15 time frames may have more false entry points.
Veja também
- All
- All
- Bearish Rectangle
- Bearish Symmetrical Triangle
- Bearish Symmetrical Triangle
- Bullish Rectangle
- Double Top
- Double Top
- Triple Bottom
- Triple Bottom
- Triple Top
- Triple Top
- All
- All
- Buy
- Sale
- All
- 1
- 2
- 3
- 4
- 5
Double Bottom
сформирован 28.04 в 08:00:12 (UTC+0)
сила сигнала 4 из 5
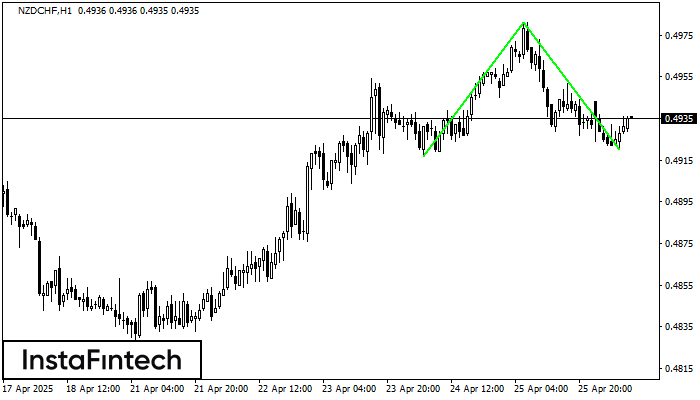
The Double Bottom pattern has been formed on NZDCHF H1. Characteristics: the support level 0.4917; the resistance level 0.4981; the width of the pattern 64 points. If the resistance level
Открыть график инструмента в новом окне
Double Top
сформирован 28.04 в 07:50:42 (UTC+0)
сила сигнала 1 из 5
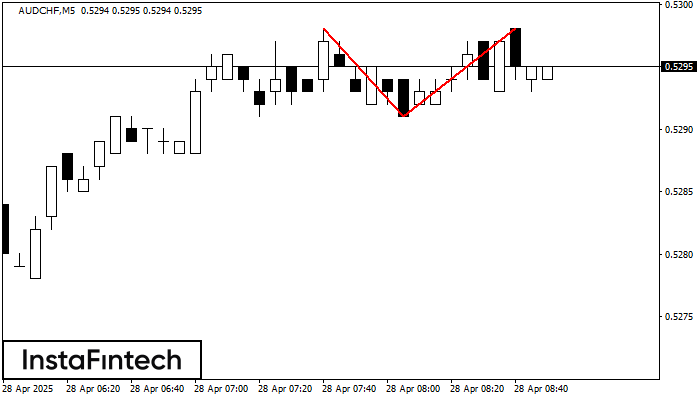
The Double Top pattern has been formed on AUDCHF M5. It signals that the trend has been changed from upwards to downwards. Probably, if the base of the pattern 0.5291
The M5 and M15 time frames may have more false entry points.
Открыть график инструмента в новом окне
Bullish Flag
сформирован 28.04 в 07:39:50 (UTC+0)
сила сигнала 1 из 5
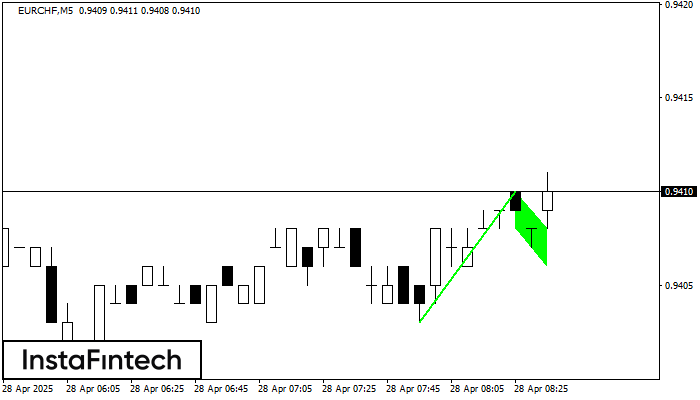
The Bullish Flag pattern has been formed on the chart EURCHF M5 which signals that the upward trend will continue. Signals: а break of the peak at 0.9410 may push
The M5 and M15 time frames may have more false entry points.
Открыть график инструмента в новом окне