Padrões atuais

Padrões são modelos gráficos que são formados no gráfico pelo preço. Segundo um dos postulados da análise técnica, a história (movimento de preços) se repete. Isso significa que os movimentos de preços geralmente são semelhantes nas mesmas situações, o que possibilita prever o desenvolvimento futuro da situação com alta probabilidade.
Os padrões relevantes da InstaTrade são um serviço fácil de usar, que permite que você esteja ciente das últimas mudanças no mercado e reaja a indícios do mercado a tempo. Em nosso serviço, você sempre encontrará os padrões mais recentes e relevantes em qualquer par e em qualquer período gráfico.
Triple Bottom
was formed on 08.04 at 02:15:19 (UTC+0)
signal strength 2 of 5
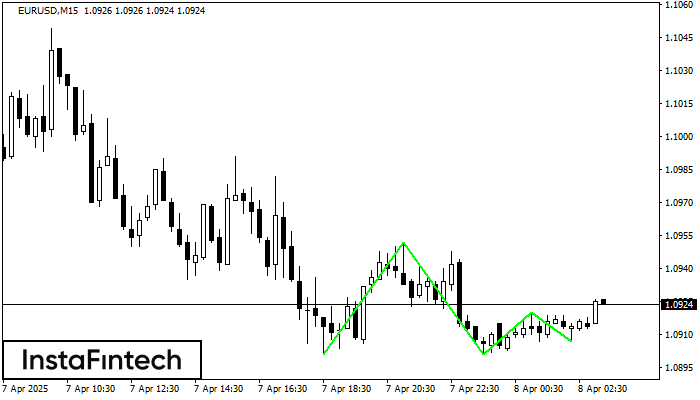
The Triple Bottom pattern has been formed on EURUSD M15. It has the following characteristics: resistance level 1.0952/1.0920; support level 1.0901/1.0907; the width is 51 points. In the event of a breakdown of the resistance level of 1.0952, the price is likely to continue an upward movement at least to 1.0924.
The M5 and M15 time frames may have more false entry points.
Veja também
- All
- All
- Bearish Rectangle
- Bearish Symmetrical Triangle
- Bearish Symmetrical Triangle
- Bullish Rectangle
- Double Top
- Double Top
- Triple Bottom
- Triple Bottom
- Triple Top
- Triple Top
- All
- All
- Buy
- Sale
- All
- 1
- 2
- 3
- 4
- 5
Triângulo Simétrico de Alta
was formed on 28.04 at 21:33:12 (UTC+0)
signal strength 4 of 5
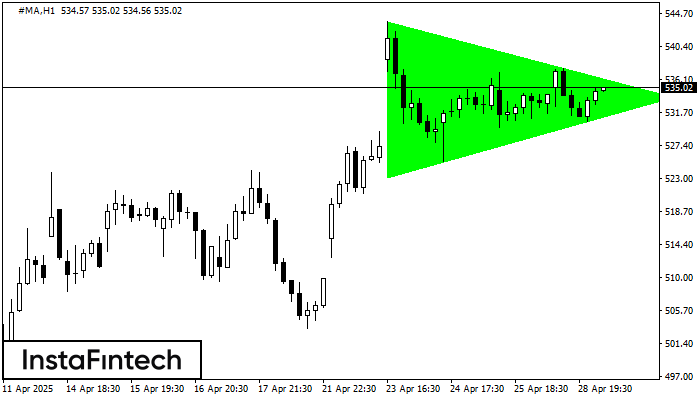
De acordo com o gráfico de H1, #MA formaram o padrão de Triângulo Simétrico de Alta. Descrição: Este é o padrão de uma continuação de tendência. 543.69 e 523.21
Open chart in a new window
Fundo duplo
was formed on 28.04 at 21:20:55 (UTC+0)
signal strength 1 of 5
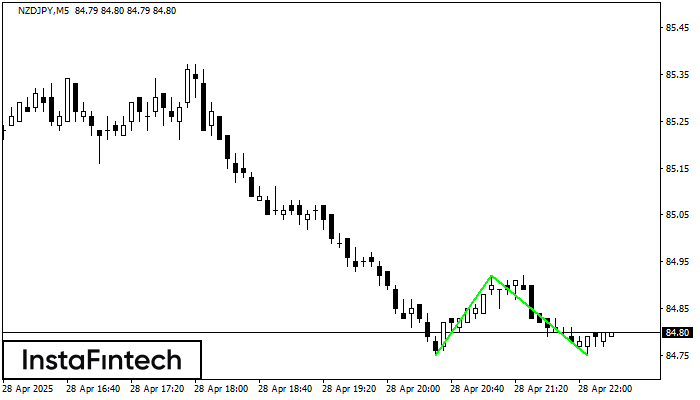
O padrão Fundo duplo foi formado em NZDJPY M5. Características: o nível de suporte 84.75; o nível de resistência 84.92; a largura do padrão 17 pontos. Se o nível
Os intervalos M5 e M15 podem ter mais pontos de entrada falsos.
Open chart in a new window
Retângulo de baixa
was formed on 28.04 at 20:16:55 (UTC+0)
signal strength 1 of 5
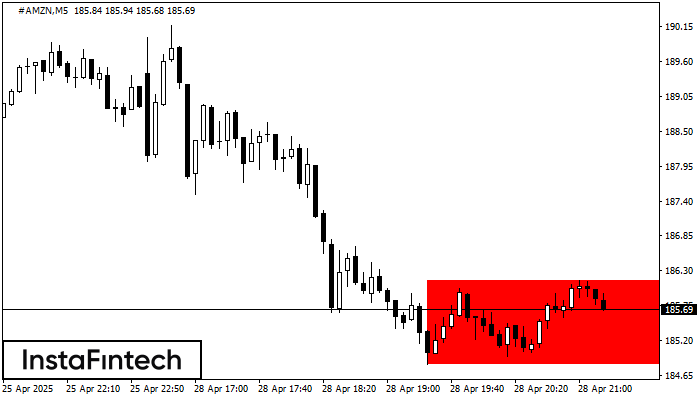
De acordo com o gráfico de M5, #AMZN formou Retângulo de baixa. O padrão indica uma continuação da tendência. O limite superior é 186.15, o limite inferior é 184.83
Os intervalos M5 e M15 podem ter mais pontos de entrada falsos.
Open chart in a new window