Padrões atuais

Padrões são modelos gráficos que são formados no gráfico pelo preço. Segundo um dos postulados da análise técnica, a história (movimento de preços) se repete. Isso significa que os movimentos de preços geralmente são semelhantes nas mesmas situações, o que possibilita prever o desenvolvimento futuro da situação com alta probabilidade.
Os padrões relevantes da InstaTrade são um serviço fácil de usar, que permite que você esteja ciente das últimas mudanças no mercado e reaja a indícios do mercado a tempo. Em nosso serviço, você sempre encontrará os padrões mais recentes e relevantes em qualquer par e em qualquer período gráfico.
Bearish Symmetrical Triangle
was formed on 04.04 at 02:03:44 (UTC+0)
signal strength 3 of 5
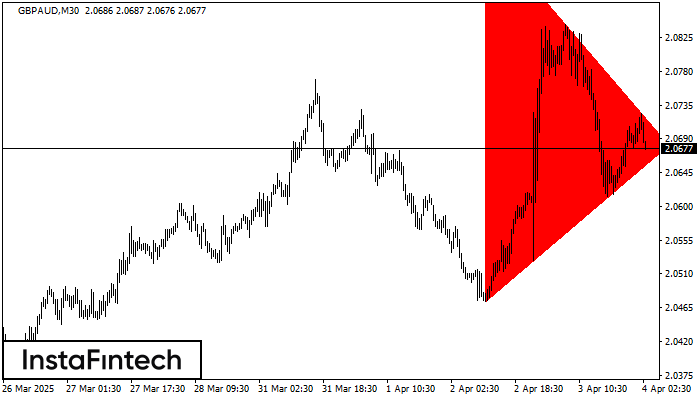
According to the chart of M30, GBPAUD formed the Bearish Symmetrical Triangle pattern. This pattern signals a further downward trend in case the lower border 2.0473 is breached. Here, a hypothetical profit will equal the width of the available pattern that is -495 pips.
Veja também
- All
- All
- Bearish Rectangle
- Bearish Symmetrical Triangle
- Bearish Symmetrical Triangle
- Bullish Rectangle
- Double Top
- Double Top
- Triple Bottom
- Triple Bottom
- Triple Top
- Triple Top
- All
- All
- Buy
- Sale
- All
- 1
- 2
- 3
- 4
- 5
Double Top
was formed on 28.04 at 14:00:25 (UTC+0)
signal strength 2 of 5
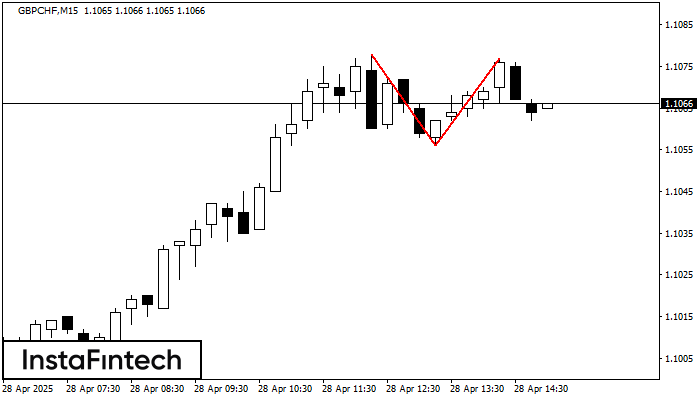
On the chart of GBPCHF M15 the Double Top reversal pattern has been formed. Characteristics: the upper boundary 1.1077; the lower boundary 1.1056; the width of the pattern 21 points
The M5 and M15 time frames may have more false entry points.
Open chart in a new window
Double Top
was formed on 28.04 at 13:45:26 (UTC+0)
signal strength 1 of 5
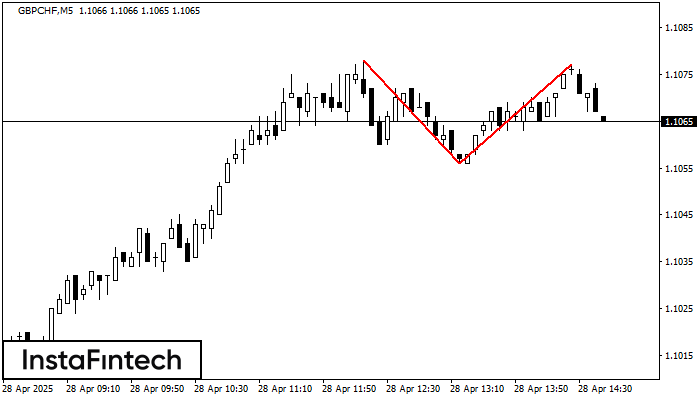
The Double Top pattern has been formed on GBPCHF M5. It signals that the trend has been changed from upwards to downwards. Probably, if the base of the pattern 1.1056
The M5 and M15 time frames may have more false entry points.
Open chart in a new window
Triple Top
was formed on 28.04 at 13:20:18 (UTC+0)
signal strength 1 of 5
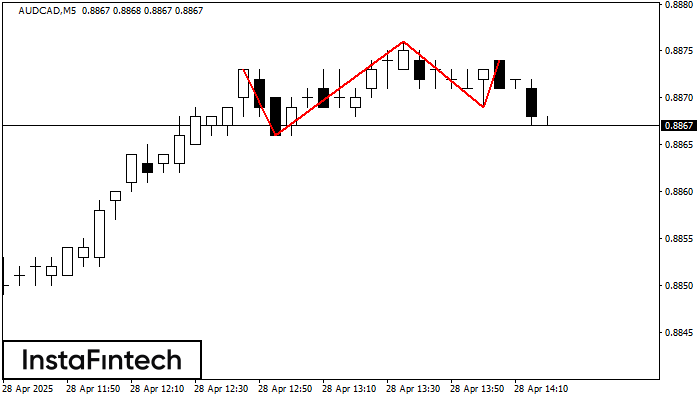
The Triple Top pattern has formed on the chart of the AUDCAD M5. Features of the pattern: borders have an ascending angle; the lower line of the pattern
The M5 and M15 time frames may have more false entry points.
Open chart in a new window