Padrões atuais

Padrões são modelos gráficos que são formados no gráfico pelo preço. Segundo um dos postulados da análise técnica, a história (movimento de preços) se repete. Isso significa que os movimentos de preços geralmente são semelhantes nas mesmas situações, o que possibilita prever o desenvolvimento futuro da situação com alta probabilidade.
Os padrões relevantes da InstaTrade são um serviço fácil de usar, que permite que você esteja ciente das últimas mudanças no mercado e reaja a indícios do mercado a tempo. Em nosso serviço, você sempre encontrará os padrões mais recentes e relevantes em qualquer par e em qualquer período gráfico.
Bearish pennant
was formed on 03.04 at 16:14:55 (UTC+0)
signal strength 1 of 5
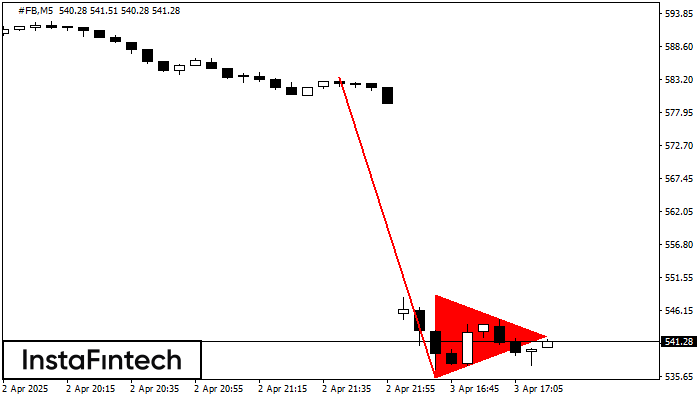
The Bearish pennant pattern has formed on the #FB M5 chart. The pattern signals continuation of the downtrend in case the pennant’s low of 535.46 is broken through. Recommendations: Place the sell stop pending order 10 pips below the pattern’s low. Place the take profit order at the projection distance of the flagpole height.
The M5 and M15 time frames may have more false entry points.
- All
- All
- Bearish Rectangle
- Bearish Symmetrical Triangle
- Bearish Symmetrical Triangle
- Bullish Rectangle
- Double Top
- Double Top
- Triple Bottom
- Triple Bottom
- Triple Top
- Triple Top
- All
- All
- Buy
- Sale
- All
- 1
- 2
- 3
- 4
- 5
Retângulo de baixa
was formed on 29.04 at 07:19:49 (UTC+0)
signal strength 1 of 5
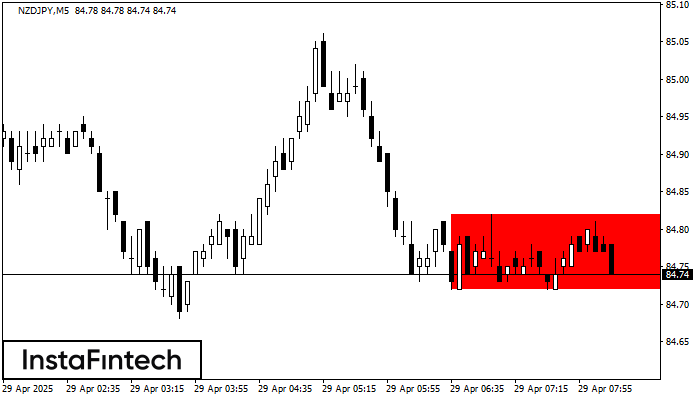
De acordo com o gráfico de M5, NZDJPY formou Retângulo de baixa. O padrão indica uma continuação da tendência. O limite superior é 84.82, o limite inferior é 84.72
Os intervalos M5 e M15 podem ter mais pontos de entrada falsos.
Open chart in a new window
Topo duplo
was formed on 29.04 at 06:00:08 (UTC+0)
signal strength 3 of 5
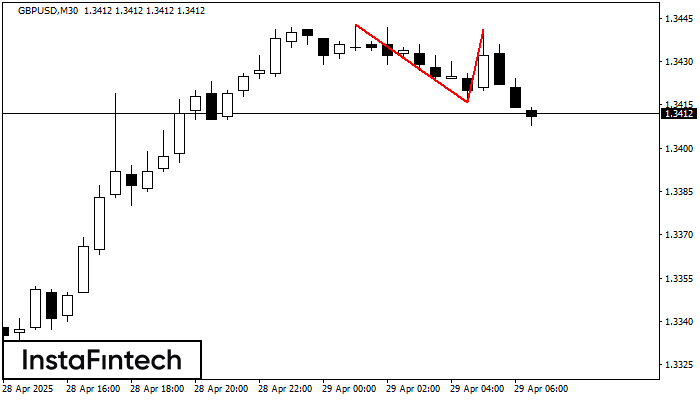
No gráfico de GBPUSD M30 o padrão de reversão Topo duplo foi formado. Características: o limite superior 1.3441; o limite inferior 1.3416; a largura do padrão 25 pontos. O sinal
Open chart in a new window
Pennant de alta
was formed on 29.04 at 05:10:17 (UTC+0)
signal strength 1 of 5
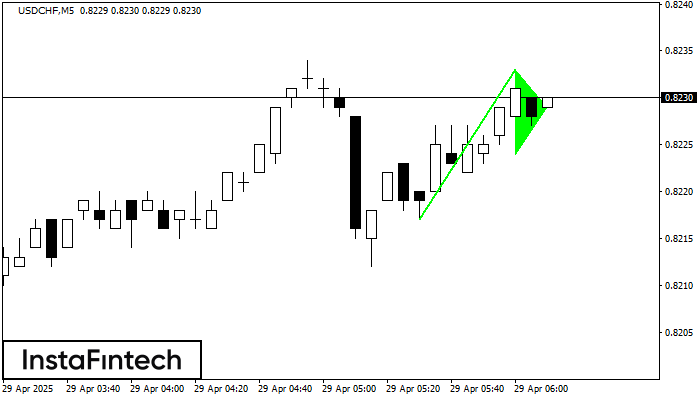
O padrão Pennant de alta é formado no gráfico USDCHF M5. Ele é um tipo do padrão de continuação. Supostamente, se o preço for fixado acima da alta de 0.8233
Os intervalos M5 e M15 podem ter mais pontos de entrada falsos.
Open chart in a new window