Veja também
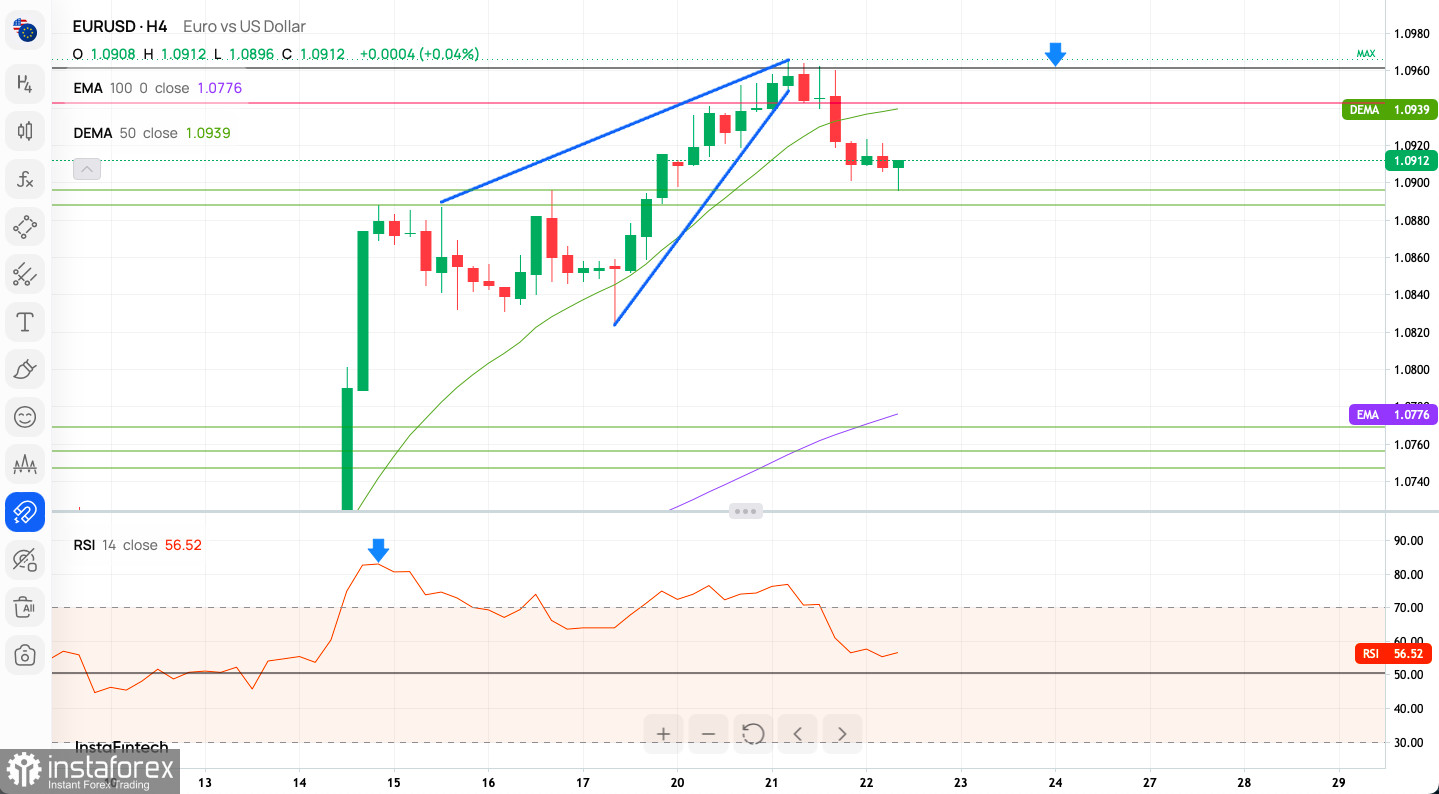
Technical Market Outlook:
The EUR/USD pair had hit the 61% Fibonacci retracement level at 1.0963 and reversed lower after the Ending Diagonal price pattern has been made at the top of the move up. The technical support seen at the level of 1.0896 had been tested already as the market conditions coming off the extremely overbought levels. Key short-term technical support rests at 1.0770, with intraday support levels identified at 1.0942 and 1.0896. The larger time frame trend remains up, but in order to rally up, the bulls needs to breakout above the level of 1.0963 again.
Weekly Pivot Points:
WR3 - 1.1246
WR2 - 1.1080
WR1 - 1.0997
Weekly Pivot - 1.0831
WS1 - 1.0748
WS2 - 1.0582
WS3 - 1.0499
Trading Outlook:
The EUR/USD market rebounded from the weekly swing low at 1.0449, persistently ascending within the ongoing counter-trend corrective cycle. Bulls are eyeing the next target at the 61% Fibonacci retracement of the recent weekly downtrend, positioned at 1.0963. A breakout above this level would serve as the initial signal for a potential long-term trend reversal in favor of the Euro.
You have already liked this post today
*A análise de mercado aqui postada destina-se a aumentar o seu conhecimento, mas não dar instruções para fazer uma negociação.
Nosso plano de negociação para as próximas horas é aguardar que o euro se recupere até os níveis de resistência próximos de 1,1429 ou 1,1435 para vender, com alvos
No gráfico de 4 horas, o instrumento da commodity prata apresenta sinais de fortalecimento. Esse cenário é confirmado pelo movimento do preço, que está acima da WMA (30, deslocamento 2)
Embora o índice Nasdaq 100 esteja se movimentando lateralmente no gráfico de 4 horas, a faixa de oscilação é relativamente ampla, o que ainda representa uma oportunidade promissora. Atualmente
Os preços do ouro passaram recentemente por uma correção significativa, refletindo as expectativas de que Estados Unidos e China iniciem negociações concretas sobre tarifas e comércio em geral. A declaração
Com a presença de uma divergência entre o movimento de preços do par AUD/JPY e o indicador Stochastic Oscillator, além do preço estar acima da média móvel ponderada (WMA)
Ao observar o gráfico de 4 horas, o ouro ainda apresenta viés de alta. No entanto, a divergência entre o movimento de preços do ouro e o indicador Stochastic Oscillator
Ao analisarmos o gráfico de 4 horas do par cruzado GBP/CHF, observamos diversos elementos interessantes. Primeiramente, o surgimento de um padrão de triângulo, aliado ao movimento
Com o par AUD/CAD se movendo acima da média móvel ponderada de 21 períodos (WMA 21), que apresenta inclinação positiva, e com a ocorrência de convergência entre o movimento
Com o surgimento da convergência entre o movimento de preço do principal par de moedas USD/JPY, o indicador Oscilador Estocástico e a posição da EMA (100), que está acima
Your IP address shows that you are currently located in the USA. If you are a resident of the United States, you are prohibited from using the services of InstaFintech Group including online trading, online transfers, deposit/withdrawal of funds, etc.
If you think you are seeing this message by mistake and your location is not the US, kindly proceed to the website. Otherwise, you must leave the website in order to comply with government restrictions.
Why does your IP address show your location as the USA?
Please confirm whether you are a US resident or not by clicking the relevant button below. If you choose the wrong option, being a US resident, you will not be able to open an account with InstaTrade anyway.
We are sorry for any inconvenience caused by this message.