Veja também


 22.04.2022 04:50 PM
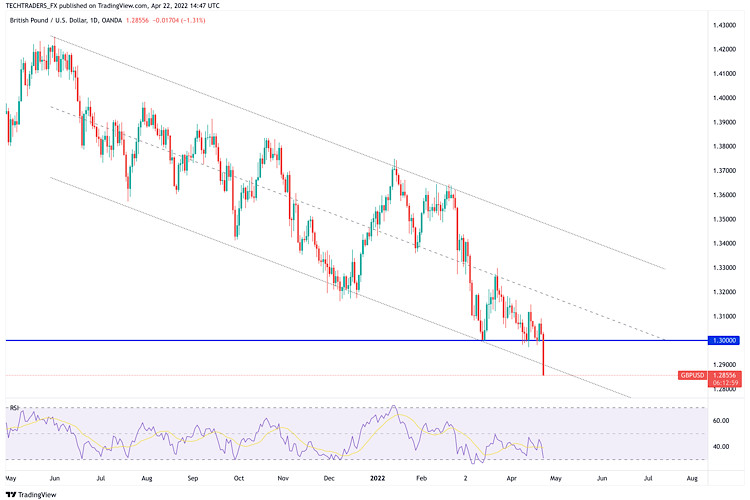
Following the sharp decline witnessed in the early European session, GBP/USD managed to recover above 1.2900 but came under renewed bearish pressure in the American trading hours. The pair remains on track to register its lowest weekly close since September 2020.
The Relative Strength Index (RSI) indicator on the four-hour chart fell below 30 early Friday. Although this development suggests that the pair could stage a correction before the next leg lower, buyers are likely to stay on the sidelines until the pair clears 1.2970 (former static support) and 1.3000 (psychological level).
On the downside, 1.2850 (static level from October 2020) aligns as the next bearish target ahead of 1.2800 (psychological level) and 1.2730 (static level from October 2020).
You have already liked this post today
*A análise de mercado aqui postada destina-se a aumentar o seu conhecimento, mas não dar instruções para fazer uma negociação.
No início da sessão americana, o ouro está sendo negociado próximo do nível de US$ 3.310, região onde se encontra a média móvel simples de 21 períodos (SMA 21)
Nosso plano de negociação para as próximas horas prevê vendas abaixo de 1,1410, visndo chegar em 1,1370 e 1,1230. O indicador Eagle sinaliza uma possível reversão, reforçando nossa expectativa
Por outro lado, se a pressão de baixa prevalecer e o euro se consolidar abaixo de 1,1370, isso pode ser interpretado como um sinal de venda, com alvos no nível
O indicador Eagle está mostrando sinais de sobrevenda, portanto, acreditamos que o ouro poderia retomar seu ciclo de alta no curto prazo após uma correção técnica e atingir o nível
Nosso plano de negociação para as próximas horas é aguardar que o euro se recupere até os níveis de resistência próximos de 1,1429 ou 1,1435 para vender, com alvos
No gráfico de 4 horas, o instrumento da commodity prata apresenta sinais de fortalecimento. Esse cenário é confirmado pelo movimento do preço, que está acima da WMA (30, deslocamento 2)
Embora o índice Nasdaq 100 esteja se movimentando lateralmente no gráfico de 4 horas, a faixa de oscilação é relativamente ampla, o que ainda representa uma oportunidade promissora. Atualmente
 Our new app for your convenient and fast verification
Gráfico de Forex
Versão-Web

Your IP address shows that you are currently located in the USA. If you are a resident of the United States, you are prohibited from using the services of InstaFintech Group including online trading, online transfers, deposit/withdrawal of funds, etc.
If you think you are seeing this message by mistake and your location is not the US, kindly proceed to the website. Otherwise, you must leave the website in order to comply with government restrictions.
Why does your IP address show your location as the USA?
Please confirm whether you are a US resident or not by clicking the relevant button below. If you choose the wrong option, being a US resident, you will not be able to open an account with InstaTrade anyway.
We are sorry for any inconvenience caused by this message.

