empty
15.05.2020 08:38 AM
Fractal analysis of Gold, Silver, Oil and Natural Gas on May 15

Forecast for May 15:

Analytical review in H1 scale:

This image is no longer relevant

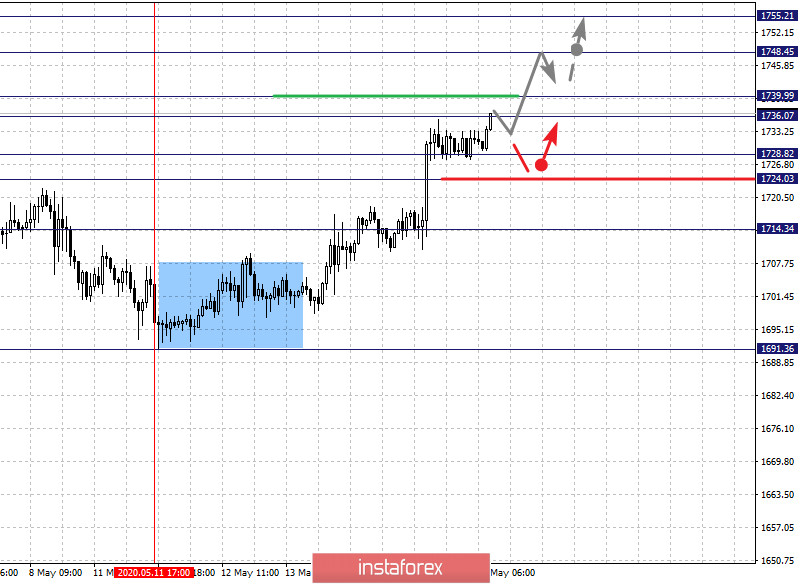
For Gold, the main key levels on the H1 scale are: 1755.21, 1748.45, 1739.99, 1736.07, 1728.82, 1724.03 and 1714.34. Here, we are following the development of the local ascending structure of May 11. The continuation of the upward movement is expected after the price passes the noise range of 1736.07 - 1739.99. In this case, the target is 1748.45 and price consolidation is near this level. For the potential value for the top, we consider the level 1755.21. Upon reaching which, we expect a downward pullback.

A short-term downward movement is possible in the range of 1728.82 - 1724.03. The breakdown of the last level will lead to an in-depth correction. In this case, the target is 1714.34. This level is a key support for the top.

The main trend is the local ascending structure of May 11

Trading recommendations:

Buy: 1740.00 Take profit: 1748.00

Buy: 1749.50 Take profit: 1755.00

Sell: 1728.50 Take profit: 1724.50

Sell: 1723.00 Take profit: 1715.00

This image is no longer relevant

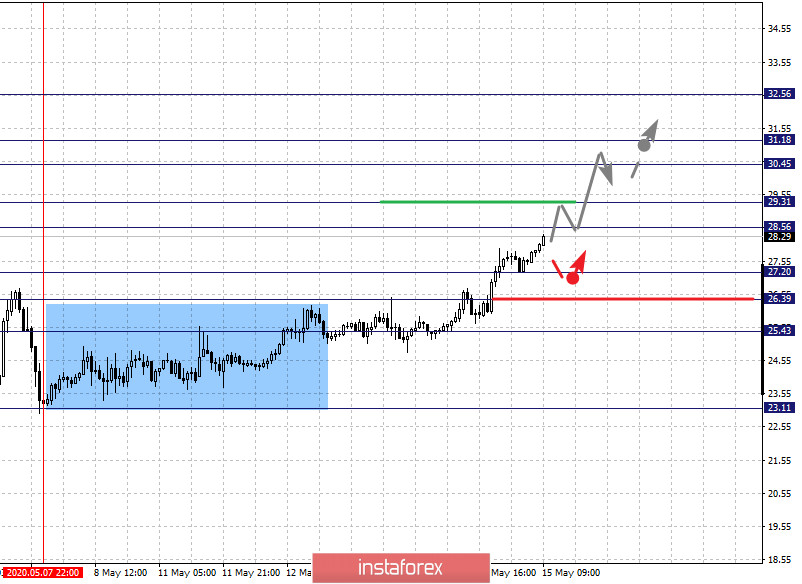
For Oil, the main key levels on the H1 scale are: 32.56, 31.18, 29.31, 28.56, 27.20, 26.39 and 25.43. Here, we are following the development of the local ascending structure of May 7. Short-term upward movement is expected in the range of 28.56 - 29.31. The breakdown of the last level will lead to a pronounced upward movement. Here, the target is 30.45. Price consolidation is in the range of 30.45 - 31.18. For the potential value for the top, we consider the level of 32.56. Upon reaching which, we expect a downward pullback.

A short-term downward movement is possible in the range of 27.20 - 26.39. The breakdown of the last level will lead to an in-depth correction. Here, the goal is 25.43. This level is a key support for the top.

The main trend is the local ascending structure of May 7

Trading recommendations:

Buy: 28.56 Take profit: 29.30

Buy: 29.50 Take profit: 30.45

Sell: 27.20 Take profit: 26.43

Sell: 26.35 Take profit: 25.45

This image is no longer relevant

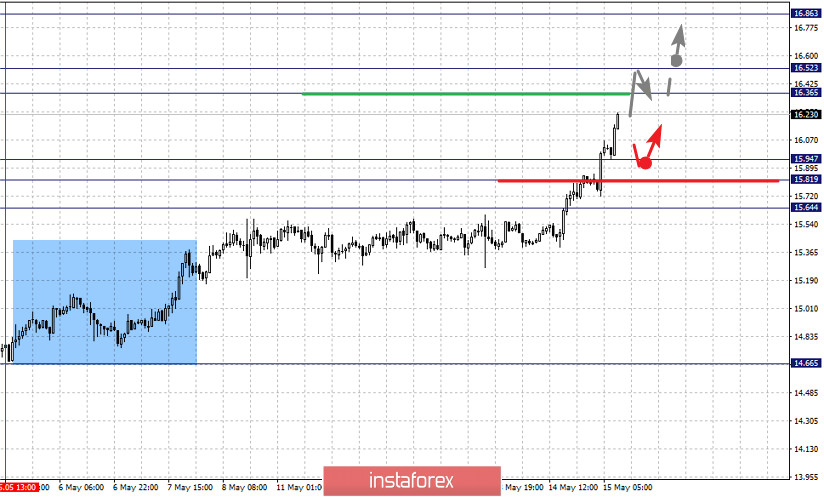
For Silver, the main key levels on the H1 scale are: 16.86, 16.52, 16.36, 15.94, 15.81 and 15.64. Here, we are following the ascending structure of May 5. At the moment, we expect to reach the level of 16.36. Short-term upward movement, as well as consolidation is in the range of 16.36 - 16.52. For the potential value for the top, we consider the level of 16.86. The movement to which is expected after the breakdown of the level of 16.52.

A short-term downward movement is possible in the range of 15.94 - 15.81. The breakdown of the last level will lead to an in-depth correction. Here, the target is 15.64. This level is a key support for the upward trend.

The main trend is the upward structure of May 5

Trading recommendations:

Buy: 16.36 Take profit: 16.50

Buy: 16.54 Take profit: 16.86

Sell: 15.94 Take profit: 15.81

Sell: 15.79 Take profit: 15.65

This image is no longer relevant

For Natural Gas, the main key levels on the H1 scale are: 1.858, 1.822, 1.724, 1.657, 1.568, 1.510 and 1.393. Here, we are following the development of the downward structure of May 5. At the moment, the price is in correction. Short-term downward movement is expected in the range of 1.568 - 1.510. The breakdown of the last level will allow us to expect movement to a potential target - 1.393. Upon reaching this level, we expect an upward pullback.

A consolidated movement is possible in the range of 1.657 - 1.724. The breakdown of the last level will lead to an in-depth correction. Here, the potential target is 1.822. The range of 1.822 - 1.858 is a key support for the downward trend. We expect the initial conditions for the upward cycle to be formed before it.

The main trend is the descending structure of May 5, the correction stage

Trading recommendations:

Buy: Take profit:

Buy: 1.735 Take profit: 1.820

Sell: 1.568 Take profit: 1.515

Sell: 1.505 Take profit: 1.395

Daichi Takahashi,
Analytical expert of InstaTrade
© 2007-2025

Recommended Stories

China intensifica retórica e emite alerta

A China emitiu um alerta a países que considerem firmar acordos com os Estados Unidos que possam prejudicar seus interesses, intensificando ainda mais a atual guerra comercial com Washington

Jakub Novak 14:31 2025-04-22 UTC+2

Previsão semanal baseada na análise de onda simplificada para EUR/USD, USD/JPY, GBP/JPY, USD/CAD, NZD/USD e ouro em 4 de novembro

EUR/USD Análise: No curto prazo, a estrutura da onda principal do euro indica uma tendência de alta que começou em meados de abril deste ano. Nos últimos dois meses

Isabel Clark 17:18 2024-11-04 UTC+2

Sinais de negociação para o EUR/USD para 24-26 de setembro de 2024: venda abaixo de 1,1150 (7/8 de Murray - SMA 21)

No início da sessão americana, o euro (EUR/USD) está sendo negociado abaixo da SMA de 21 períodos e acima do nível 6/8 de Murray, indicando sinais de exaustão. O instrumento

Dimitrios Zappas 15:20 2024-09-24 UTC+2

Análise técnica do movimento intradiário de preços do par AUD/JPY, quarta-feira, 29 de maio de 2024.

No gráfico de 4 horas do par de moedas AUD/JPY, há um sinal indicando possível queda. Isso é mostrado por uma barra vermelha aparecendo, junto com a orientação descendente

Arief Makmur 15:10 2024-05-29 UTC+2

Análise fractal do ouro, prata, petróleo e gás natural em 12 de maio

Revisão analítica do ouro, prata, gás natural e petróleo. Para o ouro, o preço formou um pequeno potencial para o movimento descendente de 8 de maio. O nível de 1691,36

Daichi Takahashi 22:42 2020-05-12 UTC+2

Análise fractal do Ouro, Prata, e Petróleo para 30 de abril.

O preço do ouro formou uma potencial tendência de baixa semelhante a de 23 de Abril, esperando desenvolvimento desta estrutura após a desagregação de 1690,06, e o nível de apoio-chave

Daichi Takahashi 23:51 2020-04-30 UTC+2

Análise fractal do Ouro, Prata e Petróleo em 27 de abril

Revisão analítica de ouro, prata e petróleo. Para o ouro, seguimos a formação das condições iniciais para o ciclo ascendente de 21 de abril. O nível de 1740,00

Daichi Takahashi 23:51 2020-04-27 UTC+2

Análise fractal do Ouro, Prata, e Petróleo em 24 de abril

Para o Ouro, estamos acompanhando a formação das condições iniciais para o ciclo ascendente de 21 de Abril. O nível de 1740,00 é a resistência chave, enquanto o nível

Daichi Takahashi 23:30 2020-04-24 UTC+2

Análise fractal do Ouro, Prata e Petróleo para 20 de abril.

Revisão analítica de ouro, prata e Oil Para o ouro, o preço forma as condições iniciais do ciclo descendente a partir de 16 de abril e o nível de 1661,00

Daichi Takahashi 21:20 2020-04-20 UTC+2

Análise fractal do Ouro, Prata e Petróleo em 17 de abril.

Revisão analítica de Ouro, Prata e Petróleo. Para o Ouro, o preço está na zona de correção da tendência ascendente e aqui, esperamos as condições iniciais expressas para o ciclo

Daichi Takahashi 20:54 2020-04-17 UTC+2
Não pode falar agora?
Faça sua pergunta no chat.
 

Dear visitor,

Your IP address shows that you are currently located in the USA. If you are a resident of the United States, you are prohibited from using the services of InstaFintech Group including online trading, online transfers, deposit/withdrawal of funds, etc.

If you think you are seeing this message by mistake and your location is not the US, kindly proceed to the website. Otherwise, you must leave the website in order to comply with government restrictions.

Why does your IP address show your location as the USA?

  • - you are using a VPN provided by a hosting company based in the United States;
  • - your IP does not have proper WHOIS records;
  • - an error occurred in the WHOIS geolocation database.

Please confirm whether you are a US resident or not by clicking the relevant button below. If you choose the wrong option, being a US resident, you will not be able to open an account with InstaTrade anyway.

We are sorry for any inconvenience caused by this message.