اصل پیٹرن یعنی ایکچوئل پیٹرن

پیٹرن تصویری صورت یعنی گرافکل ماڈلز ہوتے ہیں جو کہ چارٹ میں قیمت کی جانب سے بنتے ہیں جو کہ ٹیکنیکل تجزیات کے امکانات ، ہسٹری {قیمت کے اتار چڑھاو} چونکہ قیمت اپنے آپ کو دہراتی ہے - جس کا مطلب یہ ہے کہ قیمت کا اتار چڑھا یعنی حرکت ایک جیسے حالات میں ہی عموما مختلف ہوتی ہے جو کہ اس بات کو ممکن بناتی ہے قیمت کے مزید رویہ کی پیشن گوئی کی جاسکے جس کا اُسی طرح ہونے کے امکانات خاصے واضح ہوتے ہیں
انسٹا فاریکس کی "ریلی وینٹ" پیٹرنز نامی سروس استعمال میں بہت ہی آسان ہے جو کہ آپ کو مارکیٹ میں ہونے والی تازہ ترین تبدیلیوں کے حوالے باخبر رکھتے ہیں اور مارکیٹ کے ملنے والے اشاروں پر بر وقت در عمل دینے کے قابل کرتے ہیں - ہماری سہولیات سے آپ ہمیشہ پائیں گے تازہ ترین اور سب سے ذیادہ کار آمد انداز یعنی ریلی وینٹ انداز دستیاب ہوں گے- جو کہ کسی بھی پئیر اور ٹائم فریم کے حوالے سے دستیاب ہوں گے
Bullish Symmetrical Triangle
was formed on 08.04 at 08:31:09 (UTC+0)
signal strength 1 of 5
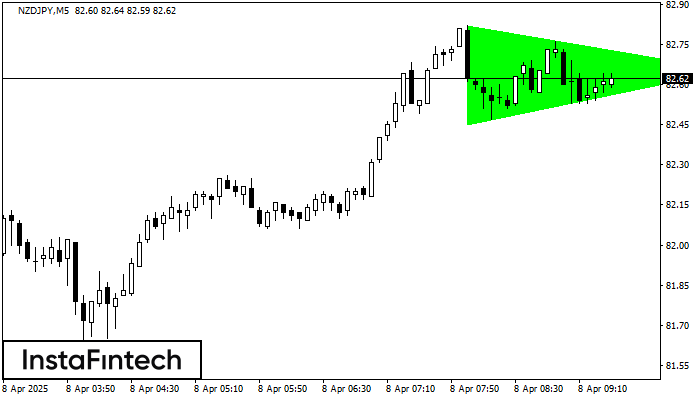
According to the chart of M5, NZDJPY formed the Bullish Symmetrical Triangle pattern. Description: This is the pattern of a trend continuation. 82.82 and 82.45 are the coordinates of the upper and lower borders respectively. The pattern width is measured on the chart at 37 pips. Outlook: If the upper border 82.82 is broken, the price is likely to continue its move by 82.80.
The M5 and M15 time frames may have more false entry points.
- All
- All
- Bearish Rectangle
- Bearish Symmetrical Triangle
- Bearish Symmetrical Triangle
- Bullish Rectangle
- Double Top
- Double Top
- Triple Bottom
- Triple Bottom
- Triple Top
- Triple Top
- All
- All
- Buy
- Sale
- All
- 1
- 2
- 3
- 4
- 5
Triángulo Simétrico Alcista
was formed on 22.04 at 00:32:37 (UTC+0)
signal strength 1 of 5

Según el gráfico de M5, el GBPAUD formó el patrón Triángulo Simétrico Alcista. El límite inferior del patrón toca las coordenadas 2.0825/2.0852 donde el límite superior cruza 2.0880/2.0852
Los marcos de tiempo M5 y M15 pueden tener más puntos de entrada falsos.
Open chart in a new window
Triángulo Simétrico Alcista
was formed on 22.04 at 00:30:42 (UTC+0)
signal strength 1 of 5

Según el gráfico de M5, AUDCAD formó el patrón Triángulo Simétrico Alcista. Descripción: Este es el patrón de la continuación de una tendencia. 0.8879 y 0.8869 son las coordenadas
Los marcos de tiempo M5 y M15 pueden tener más puntos de entrada falsos.
Open chart in a new window
Triángulo Simétrico Bajista
was formed on 22.04 at 00:27:05 (UTC+0)
signal strength 3 of 5

Según el gráfico de M30, el USDJPY formó el patrón Triángulo Simétrico Bajista. Este patrón señala una tendencia bajista en caso de que el límite inferior 140.49 sea roto. Aquí
Open chart in a new window