یہ بھی دیکھیں


 10.12.2024 06:52 AM
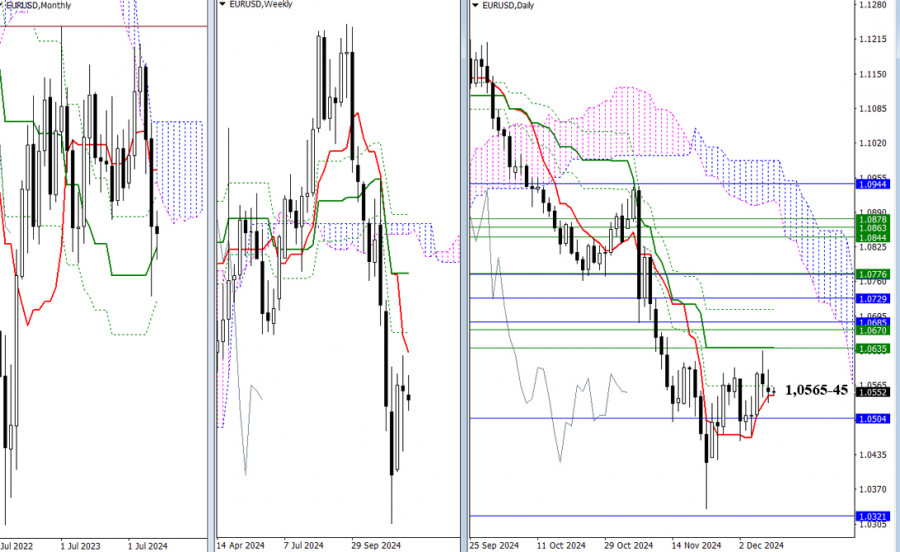
Yesterday brought no significant changes. The market leaned toward indecision and a narrow trading range. Daily levels at 1.0565 – 1.0545 are currently exerting gravitational pull. For further development, bulls must focus on breaking a broad resistance zone formed by levels across various timeframes, including 1.0635, 1.0670, and 1.0685. Bears need to dismantle the monthly Ichimoku golden cross levels at 1.0504 – 1.0321 to gain new prospects.
On the lower timeframes, the pair continues moving sideways without forming new extremes, with indecision prevailing. The pair trades slightly above the weekly long-term trend at 1.0542, giving bulls a slight edge. If the price rises, intraday resistance levels are 1.0588, 1.0622, and 1.0650, as classic Pivot Points indicate. A break below the 1.0542 trend line and a reversal would shift the balance of power, encouraging bears to target the Pivot support levels at 1.0526, 1.0498, and 1.0464.
***
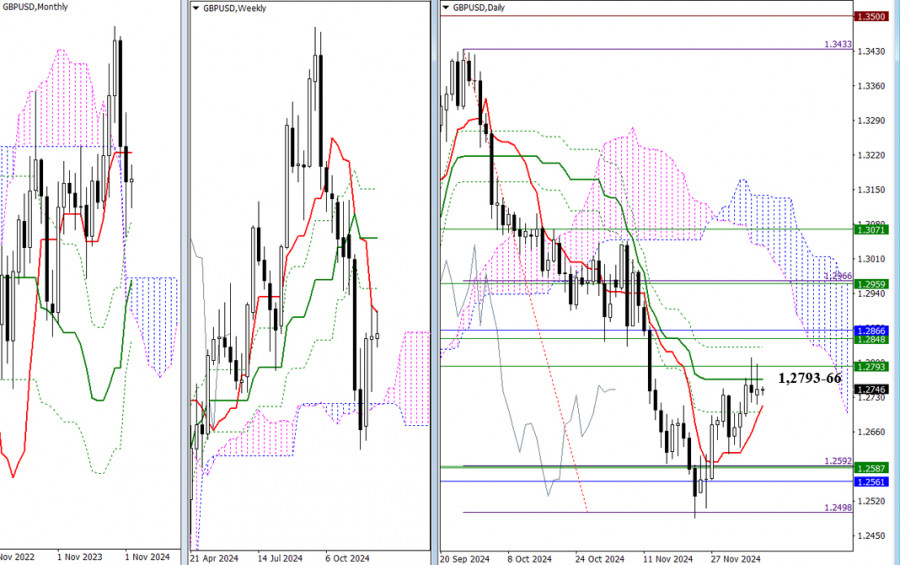
Bears failed to extend their movement yesterday or form rejection from the resistance levels at 1.2793 – 1.2766 (daily medium-term trend + weekly short-term trend). The market is currently consolidating. Today's closest supports are at 1.2700 – 1.2713. If bulls break above the current resistances, they will face another obstacle from different levels of higher timeframes, including 1.2832, 1.2848, and 1.2866.
The market trades above the weekly long-term trend at 1.2720 on the lower timeframes, maintaining the bullish advantage. If the price rises, intraday resistance levels based on classic Pivot Points are 1.2791, 1.2835, and 1.2873. A breakout and reversal of the trend would shift focus to the Pivot support levels at 1.2709, 1.2671, and 1.2627, intensifying bearish sentiment if the price drops below these levels.
***
You have already liked this post today
*تعینات کیا مراد ہے مارکیٹ کے تجزیات یہاں ارسال کیے جاتے ہیں جس کا مقصد آپ کی بیداری بڑھانا ہے، لیکن تجارت کرنے کے لئے ہدایات دینا نہیں.


