Actual patterns

Patterns are graphical models which are formed in the chart by the price. According to one of the technical analysis postulates, history (price movement) repeats itself. It means that the price movements are often similar in the same situations which makes it possible to predict the further development of the situation with a high probability.
Relevant patterns by InstaTrade is an easy-to-use service which allows you to be aware of latest changes in the market and react to clues from the market in time. In our service you will always find the latest and most relevant patterns on any pair and any timeframe.
Double Top
was formed on 14.04 at 11:20:29 (UTC+0)
signal strength 1 of 5
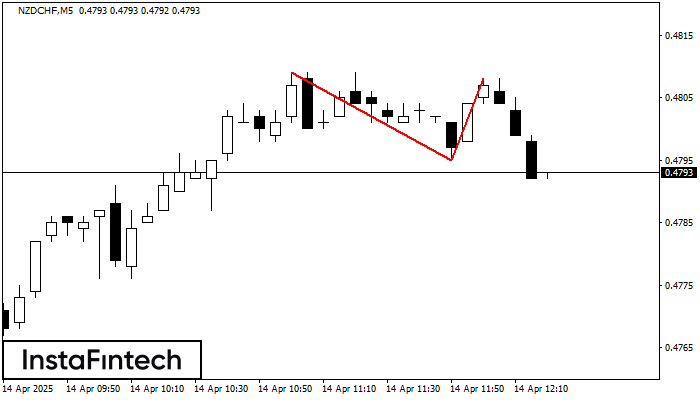
The Double Top reversal pattern has been formed on NZDCHF M5. Characteristics: the upper boundary 0.4809; the lower boundary 0.4795; the width of the pattern is 13 points. Sell trades are better to be opened below the lower boundary 0.4795 with a possible movements towards the 0.4780 level.
The M5 and M15 time frames may have more false entry points.
- All
- All
- Bearish Rectangle
- Bearish Symmetrical Triangle
- Bearish Symmetrical Triangle
- Bullish Rectangle
- Double Top
- Double Top
- Triple Bottom
- Triple Bottom
- Triple Top
- Triple Top
- All
- All
- Buy
- Sale
- All
- 1
- 2
- 3
- 4
- 5
Triángulo Simétrico Bajista
was formed on 21.04 at 12:20:58 (UTC+0)
signal strength 1 of 5

Según el gráfico de M5, el GBPCHF formó el patrón Triángulo Simétrico Bajista. Recomendaciones de negociación: es posible que una ruptura del límite inferior 1.0783 fomente una continuación
Los marcos de tiempo M5 y M15 pueden tener más puntos de entrada falsos.
Open chart in a new window
Triple Piso
was formed on 21.04 at 12:15:45 (UTC+0)
signal strength 2 of 5

El patrón Triple Piso ha sido formado en el gráfico de USDJPY M15. Características del patrón: línea inferior del patrón tiene coordenadas 140.99 con el límite superior 140.99/140.92, la proyección
Los marcos de tiempo M5 y M15 pueden tener más puntos de entrada falsos.
Open chart in a new window
Rectángulo Alcista
was formed on 21.04 at 12:13:34 (UTC+0)
signal strength 1 of 5
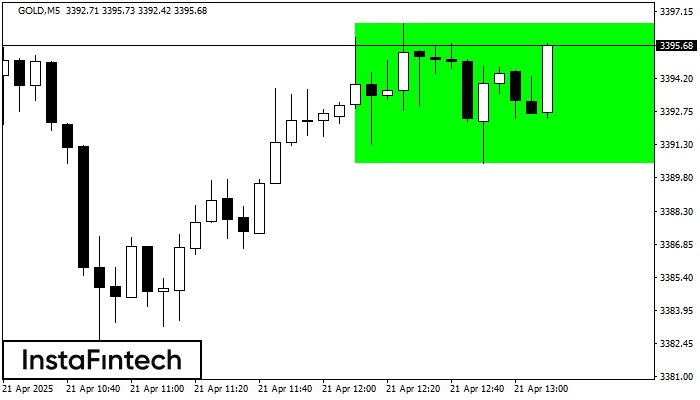
Según el gráfico de M5, GOLD formó el Rectángulo Alcista. Este tipo de patrón indica la continuación de una tendencia. Esto consiste de dos niveles: resistencia 3396.64 y soporte 3390.42
Los marcos de tiempo M5 y M15 pueden tener más puntos de entrada falsos.
Open chart in a new window