Actual patterns

Patterns are graphical models which are formed in the chart by the price. According to one of the technical analysis postulates, history (price movement) repeats itself. It means that the price movements are often similar in the same situations which makes it possible to predict the further development of the situation with a high probability.
Relevant patterns by InstaTrade is an easy-to-use service which allows you to be aware of latest changes in the market and react to clues from the market in time. In our service you will always find the latest and most relevant patterns on any pair and any timeframe.
Head and Shoulders
was formed on 02.04 at 09:15:29 (UTC+0)
signal strength 1 of 5

The NZDJPY M5 formed the Head and Shoulders pattern with the following features: The Head’s top is at 85.95, the Neckline and the upward angle are at 85.69/85.68. The formation of this pattern can bring about changes in the current trend from bullish to bearish. In case the pattern triggers the expected changes, the price of NZDJPY will go towards 85.53.
The M5 and M15 time frames may have more false entry points.
See Also
- All
- All
- Bearish Rectangle
- Bearish Symmetrical Triangle
- Bearish Symmetrical Triangle
- Bullish Rectangle
- Double Top
- Double Top
- Triple Bottom
- Triple Bottom
- Triple Top
- Triple Top
- All
- All
- Buy
- Sale
- All
- 1
- 2
- 3
- 4
- 5
Double Bottom
was formed on 22.04 at 03:50:50 (UTC+0)
signal strength 1 of 5
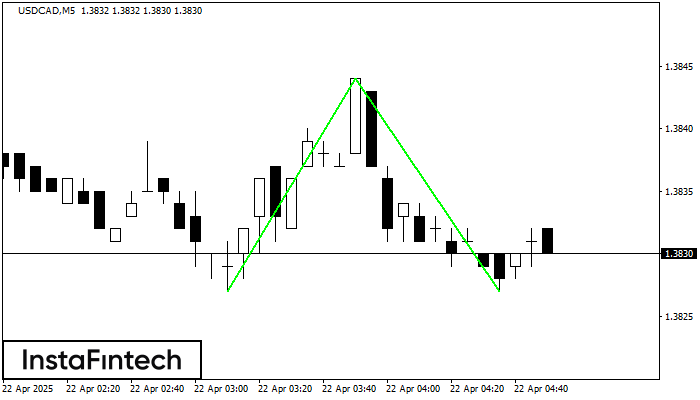
Corak Double Bottom telah dibentuk pada USDCAD M5. Pembentukan ini menandakan pembalikan aliran dari aliran menurun ke atas. Isyarat ialah perdagangan membeli harus dibuka selepas sempadan atas corak 1.3844 telah
Carta masa M5 dan M15 mungkin mempunyai lebih banyak titik kemasukan palsu.
Open chart in a new window
Triple Top
was formed on 22.04 at 02:00:16 (UTC+0)
signal strength 3 of 5

Corak Triple Top telah dibentuk pada carta bagi instrumen dagangan EURCAD M30. Ia adalah corak pembalikan yang memaparkan ciri-ciri berikut: tahap rintangan 14, tahap sokongan -60, dan lebar corak
Open chart in a new window
Segi Tiga Simetri Menaik
was formed on 22.04 at 01:47:45 (UTC+0)
signal strength 2 of 5

Berdasarkan carta M15, USDCAD membentuk corak Segi Tiga Simetri Menaik yang menandakan aliran akan berterusan. Penerangan. Sempadan atas corak menyentuh koordinat 1.3848/1.3836 sedangkan sempadan bawah merentasi 1.3821/1.3836. Lebar corak diukur
Carta masa M5 dan M15 mungkin mempunyai lebih banyak titik kemasukan palsu.
Open chart in a new window