Actual patterns

Patterns are graphical models which are formed in the chart by the price. According to one of the technical analysis postulates, history (price movement) repeats itself. It means that the price movements are often similar in the same situations which makes it possible to predict the further development of the situation with a high probability.
Relevant patterns by InstaTrade is an easy-to-use service which allows you to be aware of latest changes in the market and react to clues from the market in time. In our service you will always find the latest and most relevant patterns on any pair and any timeframe.
Bullish pennant
was formed on 02.04 at 01:45:45 (UTC+0)
signal strength 1 of 5
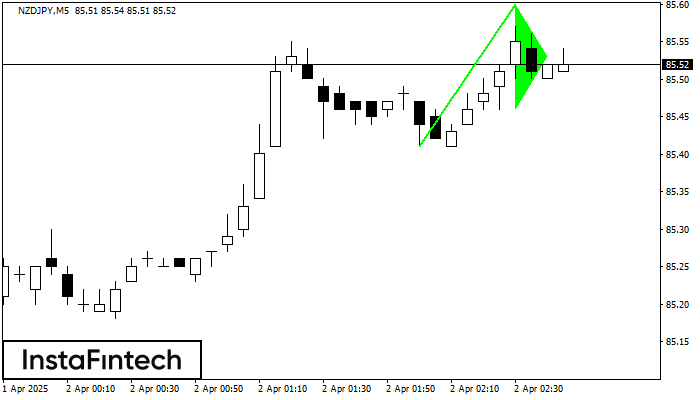
The Bullish pennant signal – Trading instrument NZDJPY M5, continuation pattern. Forecast: it is possible to set up a buy position above the pattern’s high of 85.60, with the prospect of the next move being a projection of the flagpole height.
The M5 and M15 time frames may have more false entry points.
- All
- All
- Bearish Rectangle
- Bearish Symmetrical Triangle
- Bearish Symmetrical Triangle
- Bullish Rectangle
- Double Top
- Double Top
- Triple Bottom
- Triple Bottom
- Triple Top
- Triple Top
- All
- All
- Buy
- Sale
- All
- 1
- 2
- 3
- 4
- 5
Rectángulo Bajista
was formed on 21.04 at 09:40:15 (UTC+0)
signal strength 1 of 5
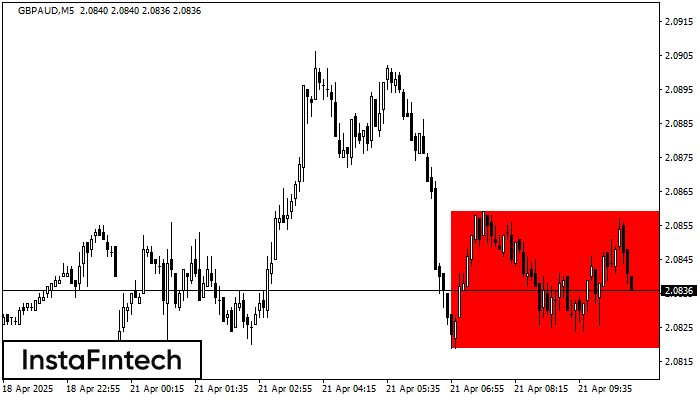
Según el gráfico de M5, GBPAUD formó el Rectángulo Bajista. El patrón indica la continuación de una tendencia. El límite superior es 2.0859, el límite inferior es 2.0819. La señal
Los marcos de tiempo M5 y M15 pueden tener más puntos de entrada falsos.
Open chart in a new window
Triángulo Simétrico Alcista
was formed on 21.04 at 09:21:18 (UTC+0)
signal strength 2 of 5
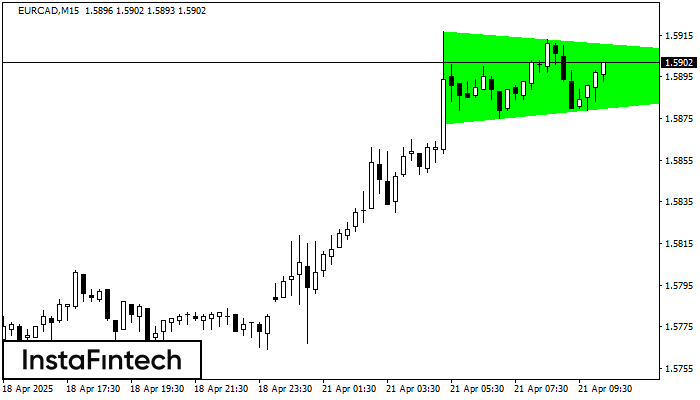
Según el gráfico de M15, EURCAD formó el patrón Triángulo Simétrico Alcista, que señala que la tendencia continuará. Descripción. El límite superior del patrón toca las coordenadas 1.5917/1.5897 donde
Los marcos de tiempo M5 y M15 pueden tener más puntos de entrada falsos.
Open chart in a new window
Rectángulo Alcista
was formed on 21.04 at 09:21:13 (UTC+0)
signal strength 2 of 5
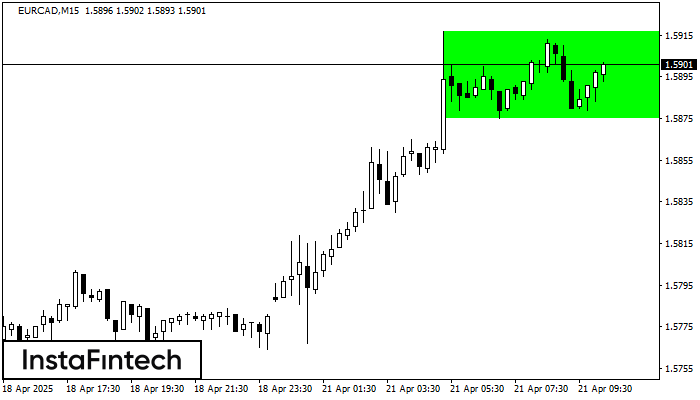
Según el gráfico de M15, EURCAD formó el Rectángulo Alcista. Este tipo de patrón indica la continuación de una tendencia. Esto consiste de dos niveles: resistencia 1.5917 y soporte 1.5875
Los marcos de tiempo M5 y M15 pueden tener más puntos de entrada falsos.
Open chart in a new window