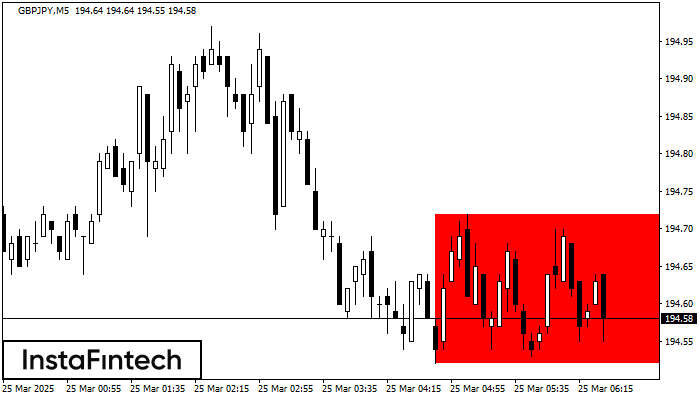
Bearish Rectangle
was formed on 25.03 at 06:33:36 (UTC+0)
signal strength 1 of 5

According to the chart of M5, GBPJPY formed the Bearish Rectangle which is a pattern of a trend continuation. The pattern is contained within the following borders: lower border 194.52 – 194.52 and upper border 194.72 – 194.72. In case the lower border is broken, the instrument is likely to follow the downward trend.
The M5 and M15 time frames may have more false entry points.
See Also
- All
- All
- Bearish Rectangle
- Bearish Symmetrical Triangle
- Bearish Symmetrical Triangle
- Bullish Rectangle
- Double Top
- Double Top
- Triple Bottom
- Triple Bottom
- Triple Top
- Triple Top
- All
- All
- Buy
- Sale
- All
- 1
- 2
- 3
- 4
- 5
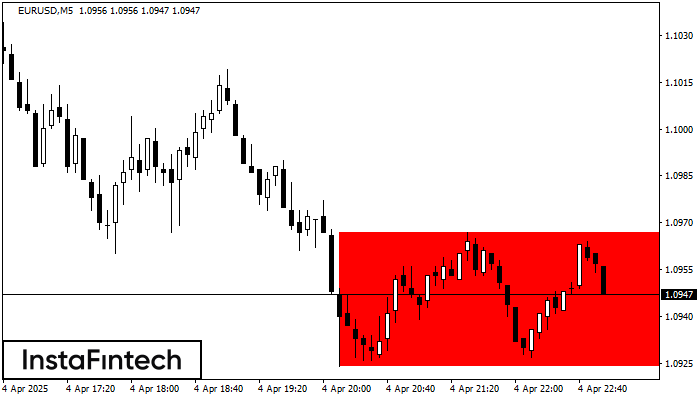
Rectángulo Bajista
was formed on 04.04 at 21:58:39 (UTC+0)
signal strength 1 of 5
Según el gráfico de M5, EURUSD formó el Rectángulo Bajista que es un patrón de la continuación de una tendencia. El patrón está contenido dentro de los siguientes límites: límite
Los marcos de tiempo M5 y M15 pueden tener más puntos de entrada falsos.
Open chart in a new window
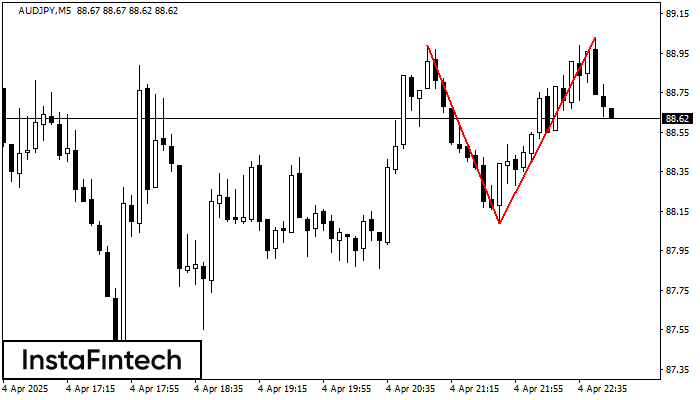
Doble Techo
was formed on 04.04 at 21:55:03 (UTC+0)
signal strength 1 of 5
El patrón Doble Techo ha sido formado en AUDJPY M5. Esto señala que la tendencia ha sido cambiada de alcista a bajista. Probablemente, si la base del patrón 88.09
Los marcos de tiempo M5 y M15 pueden tener más puntos de entrada falsos.
Open chart in a new window
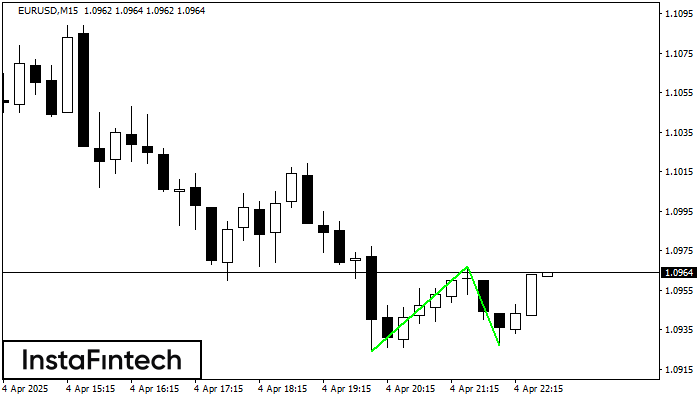
Doble Piso
was formed on 04.04 at 21:45:36 (UTC+0)
signal strength 2 of 5
El patrón Doble Piso ha sido formado en EURUSD M15; el límite superior es 1.0967; el límite inferior es 1.0927. El ancho del patrón es 43 puntos. En caso
Los marcos de tiempo M5 y M15 pueden tener más puntos de entrada falsos.
Open chart in a new window


