Долзарб паттернлар

Тройное дно
сформирован 07.04 в 19:00:23 (UTC+0)
сила сигнала 1 из 5

Сформирована фигура «Тройное дно» по торговому инструменту #EBAY на M5. Фигура сигнализирует об изменении тенденции с нисходящей на восходящую в случае пробоя верхней границы 61.26.
Таймфреймы М5 и М15 могут иметь больше ложных точек входа.
- Все
- Все
- Bearish Rectangle
- Bearish Symmetrical Triangle
- Bearish Symmetrical Triangle
- Bullish Rectangle
- Double Top
- Double Top
- Triple Bottom
- Triple Bottom
- Triple Top
- Triple Top
- Все
- Все
- Покупка
- Продажа
- Все
- 1
- 2
- 3
- 4
- 5
Double Bottom
was formed on 22.04 at 07:00:30 (UTC+0)
signal strength 1 of 5
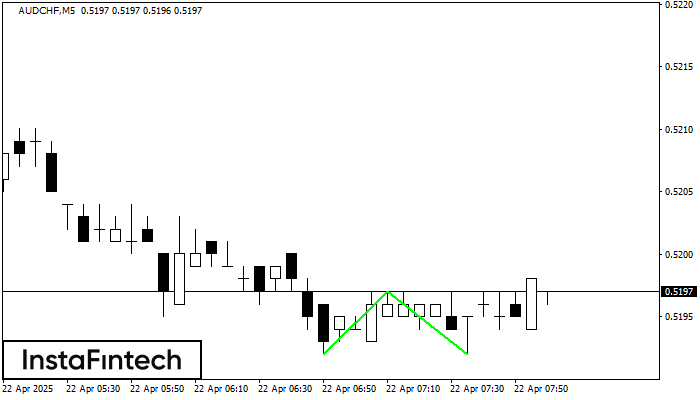
The Double Bottom pattern has been formed on AUDCHF M5; the upper boundary is 0.5197; the lower boundary is 0.5192. The width of the pattern is 5 points. In case
The M5 and M15 time frames may have more false entry points.
Open chart in a new window
Double Top
was formed on 22.04 at 06:46:04 (UTC+0)
signal strength 1 of 5
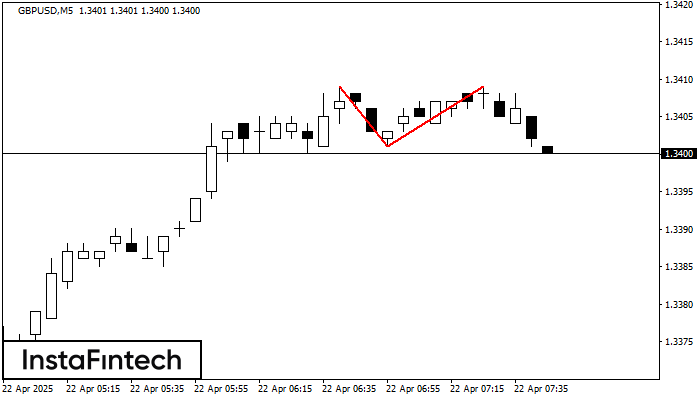
On the chart of GBPUSD M5 the Double Top reversal pattern has been formed. Characteristics: the upper boundary 1.3409; the lower boundary 1.3401; the width of the pattern 8 points
The M5 and M15 time frames may have more false entry points.
Open chart in a new window
Bearish Rectangle
was formed on 22.04 at 06:31:47 (UTC+0)
signal strength 1 of 5
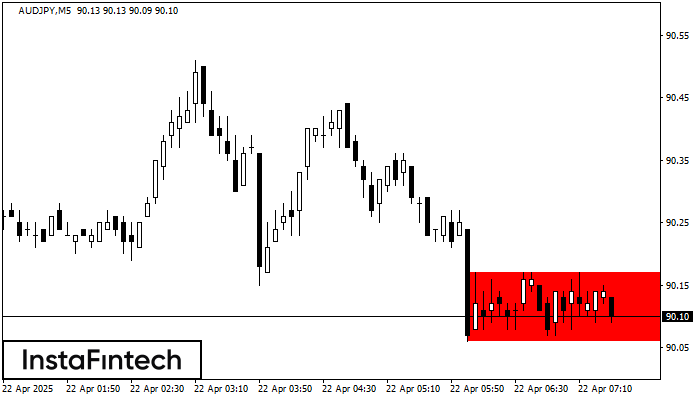
According to the chart of M5, AUDJPY formed the Bearish Rectangle. This type of a pattern indicates a trend continuation. It consists of two levels: resistance 90.17 - 0.00
The M5 and M15 time frames may have more false entry points.
Open chart in a new window