Долзарб паттернлар

Медвежий вымпел
сформирован 04.04 в 03:26:03 (UTC+0)
сила сигнала 1 из 5

На графике AUDCAD M5 сформировалась фигура «Медвежий вымпел», которая сигнализирует о возможном продолжении тренда. Характеристика: основание фигуры имеет координаты 0.8881; проекция высоты флагштока равна 21 пунктов. В случае если цена преодолеет основание фигуры 0.8881, то ожидается продолжение нисходящего тренда на уровень 0.8866 пунктов.
Таймфреймы М5 и М15 могут иметь больше ложных точек входа.
- Все
- Все
- Bearish Rectangle
- Bearish Symmetrical Triangle
- Bearish Symmetrical Triangle
- Bullish Rectangle
- Double Top
- Double Top
- Triple Bottom
- Triple Bottom
- Triple Top
- Triple Top
- Все
- Все
- Покупка
- Продажа
- Все
- 1
- 2
- 3
- 4
- 5
Bullish Symmetrical Triangle
was formed on 17.04 at 09:11:38 (UTC+0)
signal strength 1 of 5
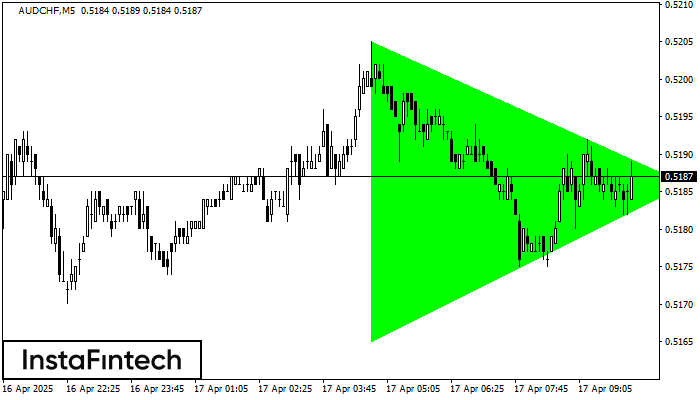
According to the chart of M5, AUDCHF formed the Bullish Symmetrical Triangle pattern. The lower border of the pattern touches the coordinates 0.5165/0.5186 whereas the upper border goes across 0.5205/0.5186
The M5 and M15 time frames may have more false entry points.
Open chart in a new window
Bullish pennant
was formed on 17.04 at 09:00:37 (UTC+0)
signal strength 1 of 5
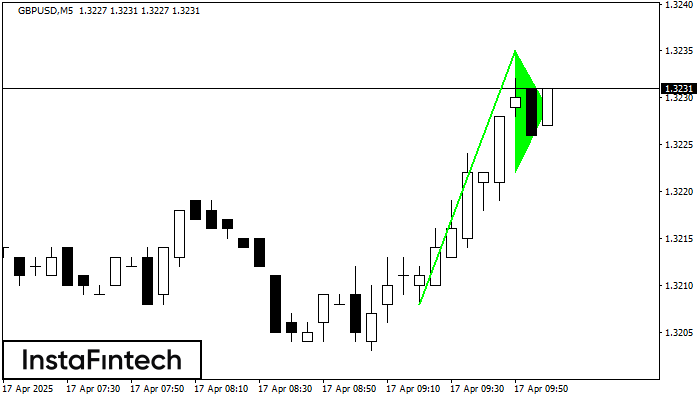
The Bullish pennant graphic pattern has formed on the GBPUSD M5 instrument. This pattern type falls under the category of continuation patterns. In this case, if the quote can breaks
The M5 and M15 time frames may have more false entry points.
Open chart in a new window
Double Bottom
was formed on 17.04 at 09:00:17 (UTC+0)
signal strength 3 of 5
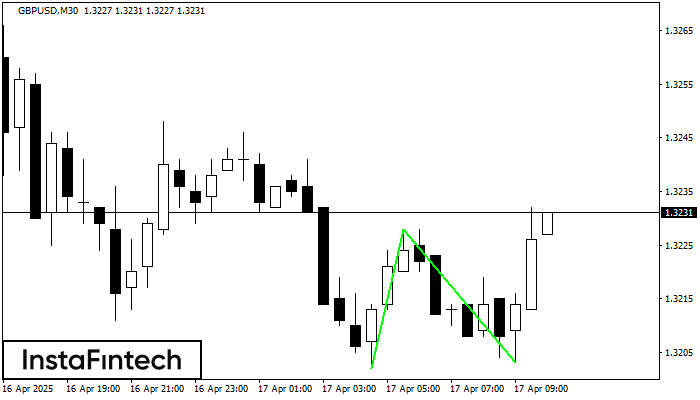
The Double Bottom pattern has been formed on GBPUSD M30; the upper boundary is 1.3228; the lower boundary is 1.3203. The width of the pattern is 26 points. In case
Open chart in a new window