Долзарб паттернлар

Двойное дно
сформирован 03.04 в 19:30:16 (UTC+0)
сила сигнала 1 из 5
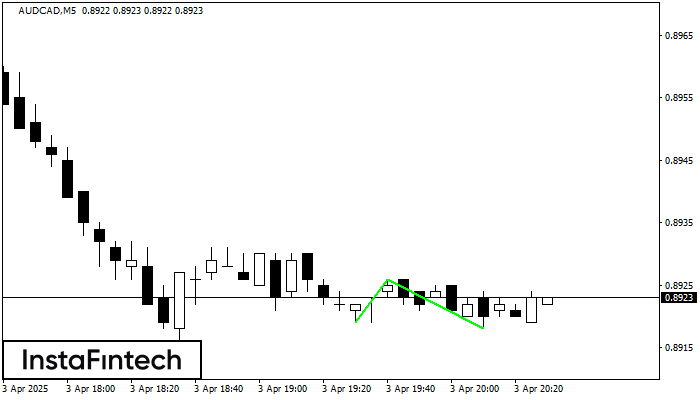
Сформирована фигура «Двойное дно» на графике AUDCAD M5. Верхняя граница 0.8926; Нижняя граница 0.8918; Ширина фигуры 7 пунктов. В случае пробоя верхней границы 0.8926 можно будет прогнозировать изменение тенденции, где ширина фигуры и будет являться расстоянием предположительного Тейк Профита.
Таймфреймы М5 и М15 могут иметь больше ложных точек входа.
- Все
- Все
- Bearish Rectangle
- Bearish Symmetrical Triangle
- Bearish Symmetrical Triangle
- Bullish Rectangle
- Double Top
- Double Top
- Triple Bottom
- Triple Bottom
- Triple Top
- Triple Top
- Все
- Все
- Покупка
- Продажа
- Все
- 1
- 2
- 3
- 4
- 5
Double Top
was formed on 22.04 at 21:25:11 (UTC+0)
signal strength 1 of 5

On the chart of #Bitcoin M5 the Double Top reversal pattern has been formed. Characteristics: the upper boundary 91658.42; the lower boundary 91095.99; the width of the pattern 56243 points
The M5 and M15 time frames may have more false entry points.
Open chart in a new window
Bearish Symmetrical Triangle
was formed on 22.04 at 21:15:28 (UTC+0)
signal strength 1 of 5

According to the chart of M5, EURNZD formed the Bearish Symmetrical Triangle pattern. Description: The lower border is 1.9072/1.9108 and upper border is 1.9137/1.9108. The pattern width is measured
The M5 and M15 time frames may have more false entry points.
Open chart in a new window
Double Top
was formed on 22.04 at 20:40:40 (UTC+0)
signal strength 1 of 5
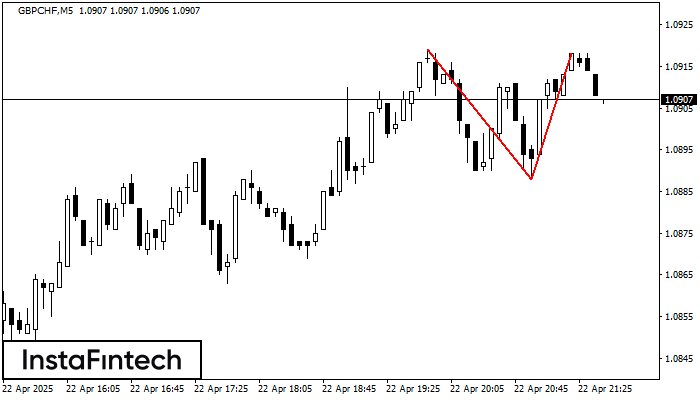
The Double Top pattern has been formed on GBPCHF M5. It signals that the trend has been changed from upwards to downwards. Probably, if the base of the pattern 1.0888
The M5 and M15 time frames may have more false entry points.
Open chart in a new window