Долзарб паттернлар

Двойная вершина
сформирован 02.04 в 09:00:10 (UTC+0)
сила сигнала 3 из 5
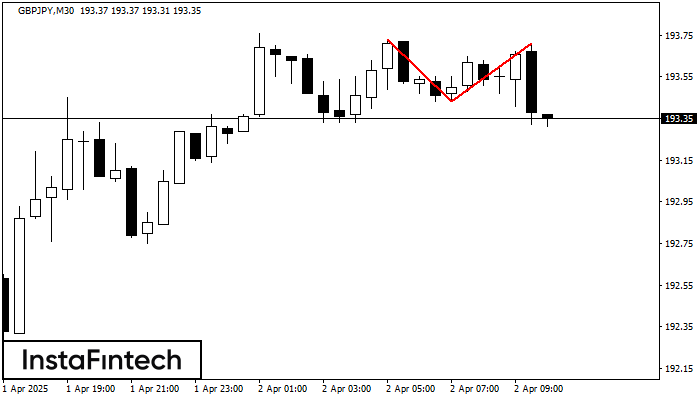
На торговом графике GBPJPY M30 сформировалась разворотная фигура «Двойная вершина». Характеристика: Верхняя граница 193.71; Нижняя граница 193.43; Ширина фигуры 28 пунктов. Сигнал: Пробой нижней границы 193.43 приведет к дальнейшему нисходящему движению с перспективой хода к уровню 193.13.
- Все
- Все
- Bearish Rectangle
- Bearish Symmetrical Triangle
- Bearish Symmetrical Triangle
- Bullish Rectangle
- Double Top
- Double Top
- Triple Bottom
- Triple Bottom
- Triple Top
- Triple Top
- Все
- Все
- Покупка
- Продажа
- Все
- 1
- 2
- 3
- 4
- 5
Double Bottom
was formed on 22.04 at 15:30:30 (UTC+0)
signal strength 4 of 5
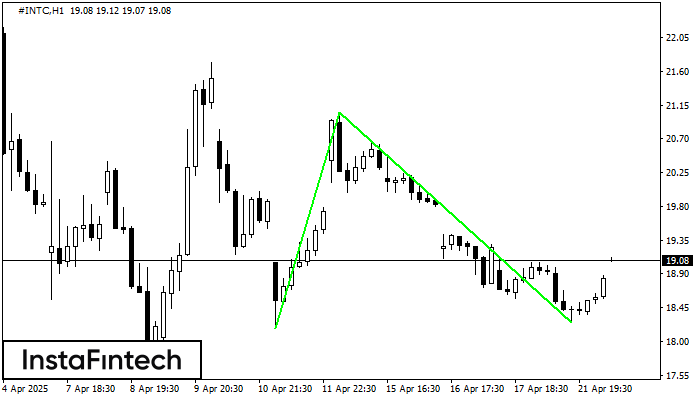
The Double Bottom pattern has been formed on #INTC H1; the upper boundary is 21.05; the lower boundary is 18.25. The width of the pattern is 287 points. In case
Open chart in a new window
Double Bottom
was formed on 22.04 at 14:06:13 (UTC+0)
signal strength 1 of 5

The Double Bottom pattern has been formed on NZDCHF M5; the upper boundary is 0.4874; the lower boundary is 0.4857. The width of the pattern is 17 points. In case
The M5 and M15 time frames may have more false entry points.
Open chart in a new window
Double Bottom
was formed on 22.04 at 13:40:19 (UTC+0)
signal strength 1 of 5

The Double Bottom pattern has been formed on GBPJPY M5. Characteristics: the support level 187.44; the resistance level 187.65; the width of the pattern 21 points. If the resistance level
The M5 and M15 time frames may have more false entry points.
Open chart in a new window