Долзарб паттернлар

Бычий симметричный треугольник
сформирован 25.03 в 05:57:23 (UTC+0)
сила сигнала 4 из 5
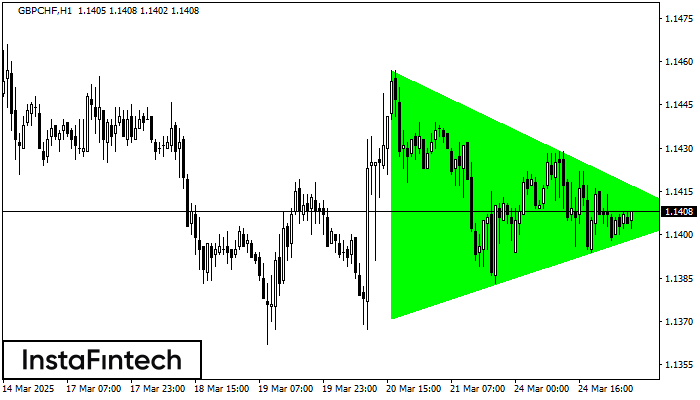
По GBPCHF на H1 фигура «Бычий симметричный треугольник». Характеристика: Фигура продолжения тренда; Координаты границ – верхняя 1.1457, нижняя 1.1371. Проекция ширины фигуры 86 пунктов. Прогноз: В случае пробоя верхней границы 1.1457 цена, вероятнее всего, продолжит движение к 1.1446.
Шунингдек кўринг
- Все
- Все
- Bearish Rectangle
- Bearish Symmetrical Triangle
- Bearish Symmetrical Triangle
- Bullish Rectangle
- Double Top
- Double Top
- Triple Bottom
- Triple Bottom
- Triple Top
- Triple Top
- Все
- Все
- Покупка
- Продажа
- Все
- 1
- 2
- 3
- 4
- 5
Bullish Rectangle
was formed on 14.04 at 08:47:26 (UTC+0)
signal strength 1 of 5
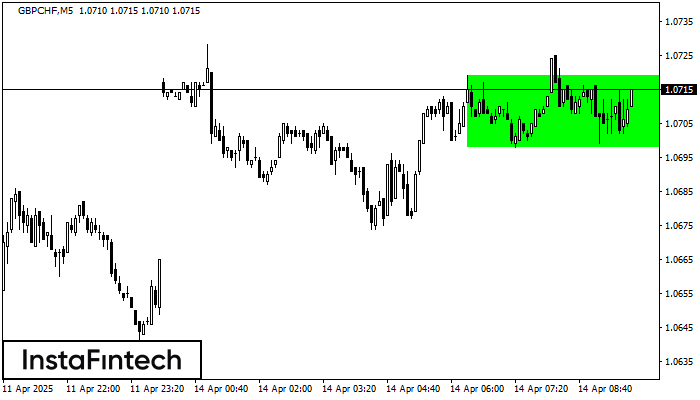
According to the chart of M5, GBPCHF formed the Bullish Rectangle which is a pattern of a trend continuation. The pattern is contained within the following borders: the lower border
The M5 and M15 time frames may have more false entry points.
Open chart in a new window
Triple Bottom
was formed on 14.04 at 08:00:19 (UTC+0)
signal strength 2 of 5
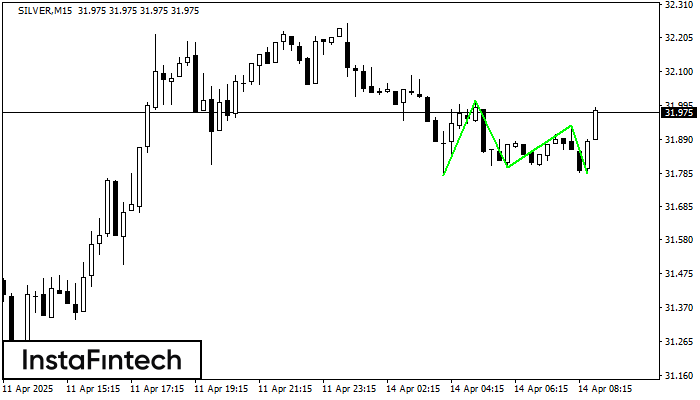
The Triple Bottom pattern has formed on the chart of the SILVER M15 trading instrument. The pattern signals a change in the trend from downwards to upwards in the case
The M5 and M15 time frames may have more false entry points.
Open chart in a new window
Triple Top
was formed on 14.04 at 07:35:12 (UTC+0)
signal strength 1 of 5
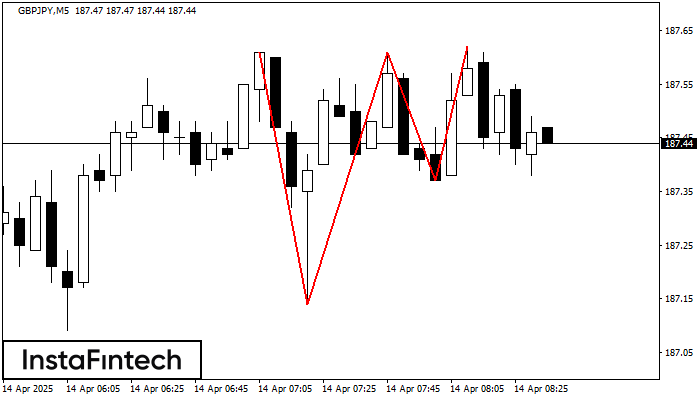
The Triple Top pattern has formed on the chart of the GBPJPY M5. Features of the pattern: borders have an ascending angle; the lower line of the pattern
The M5 and M15 time frames may have more false entry points.
Open chart in a new window