Actual patterns

Patterns are graphical models which are formed in the chart by the price. According to one of the technical analysis postulates, history (price movement) repeats itself. It means that the price movements are often similar in the same situations which makes it possible to predict the further development of the situation with a high probability.
Relevant patterns by InstaTrade is an easy-to-use service which allows you to be aware of latest changes in the market and react to clues from the market in time. In our service you will always find the latest and most relevant patterns on any pair and any timeframe.
Bullish Symmetrical Triangle
was formed on 04.04 at 05:20:08 (UTC+0)
signal strength 1 of 5

According to the chart of M5, #Bitcoin formed the Bullish Symmetrical Triangle pattern. Description: This is the pattern of a trend continuation. 83376.14 and 82331.42 are the coordinates of the upper and lower borders respectively. The pattern width is measured on the chart at 104472 pips. Outlook: If the upper border 83376.14 is broken, the price is likely to continue its move by 82907.57.
The M5 and M15 time frames may have more false entry points.
- All
- All
- Bearish Rectangle
- Bearish Symmetrical Triangle
- Bearish Symmetrical Triangle
- Bullish Rectangle
- Double Top
- Double Top
- Triple Bottom
- Triple Bottom
- Triple Top
- Triple Top
- All
- All
- Buy
- Sale
- All
- 1
- 2
- 3
- 4
- 5
Triple Top
was formed on 27.04 at 23:00:30 (UTC+0)
signal strength 1 of 5
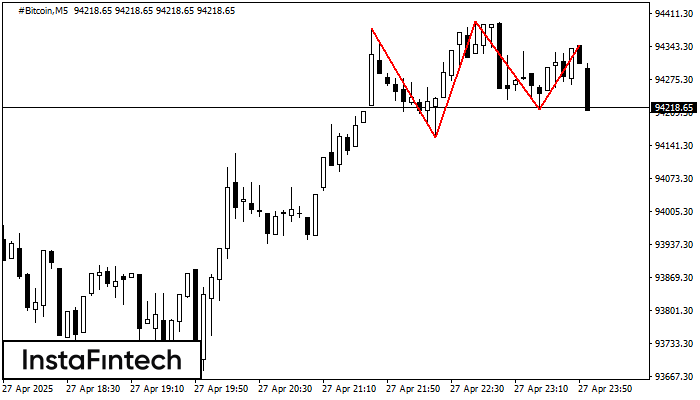
The Triple Top pattern has formed on the chart of the #Bitcoin M5 trading instrument. It is a reversal pattern featuring the following characteristics: resistance level 3568, support level -5728
The M5 and M15 time frames may have more false entry points.
Open chart in a new window
Double Top
was formed on 27.04 at 22:05:29 (UTC+0)
signal strength 1 of 5
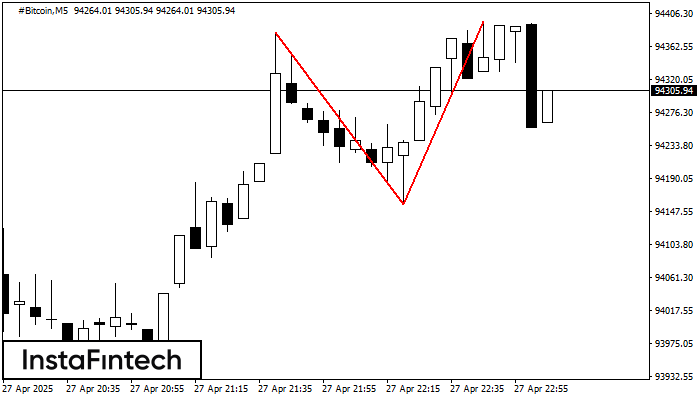
On the chart of #Bitcoin M5 the Double Top reversal pattern has been formed. Characteristics: the upper boundary 94395.37; the lower boundary 94157.00; the width of the pattern 23837 points
The M5 and M15 time frames may have more false entry points.
Open chart in a new window
Triple Bottom
was formed on 27.04 at 19:30:44 (UTC+0)
signal strength 3 of 5
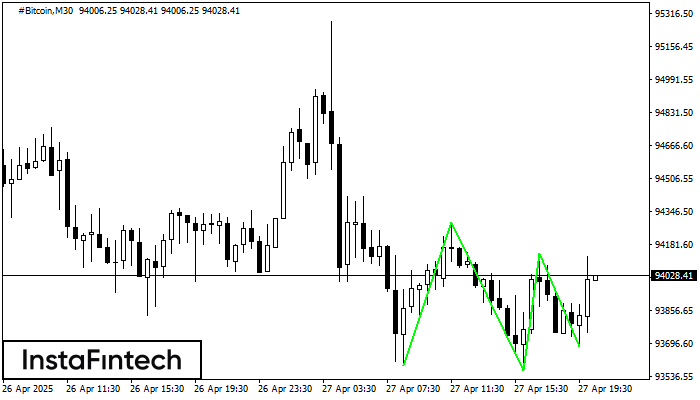
The Triple Bottom pattern has formed on the chart of #Bitcoin M30. Features of the pattern: The lower line of the pattern has coordinates 94291.97 with the upper limit 94291.97/94136.56
Open chart in a new window