Corak sebenar

Double Top
was formed on 15.04 at 14:00:31 (UTC+0)
signal strength 4 of 5
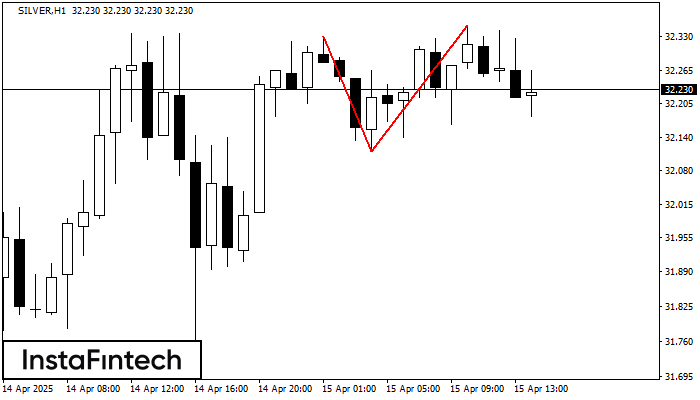
The Double Top pattern has been formed on SILVER H1. It signals that the trend has been changed from upwards to downwards. Probably, if the base of the pattern 32.12 is broken, the downward movement will continue.
- All
- All
- Bearish Rectangle
- Bearish Symmetrical Triangle
- Bearish Symmetrical Triangle
- Bullish Rectangle
- Double Top
- Double Top
- Triple Bottom
- Triple Bottom
- Triple Top
- Triple Top
- All
- All
- Buy
- Sale
- All
- 1
- 2
- 3
- 4
- 5
Double Bottom
was formed on 24.04 at 13:00:18 (UTC+0)
signal strength 2 of 5
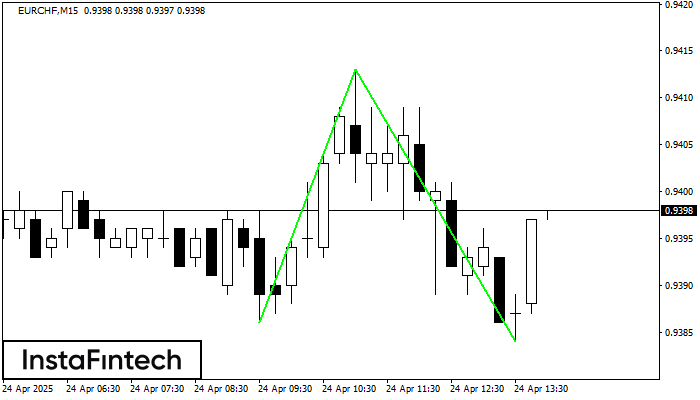
The Double Bottom pattern has been formed on EURCHF M15. Characteristics: the support level 0.9386; the resistance level 0.9413; the width of the pattern 27 points. If the resistance level
The M5 and M15 time frames may have more false entry points.
Open chart in a new window
Double Top
was formed on 24.04 at 12:35:33 (UTC+0)
signal strength 1 of 5
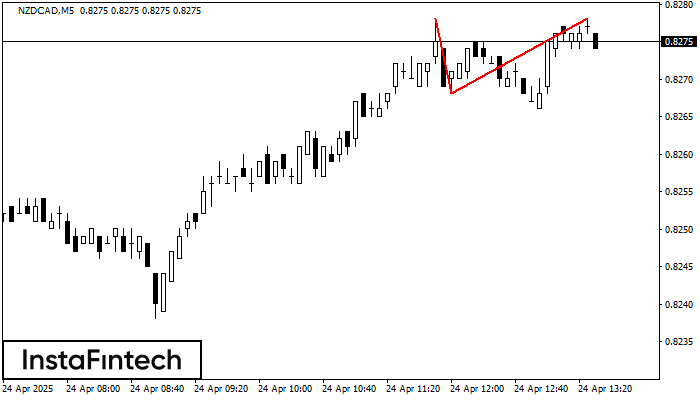
The Double Top reversal pattern has been formed on NZDCAD M5. Characteristics: the upper boundary 0.8278; the lower boundary 0.8268; the width of the pattern is 10 points. Sell trades
The M5 and M15 time frames may have more false entry points.
Open chart in a new window
Bearish Rectangle
was formed on 24.04 at 12:34:50 (UTC+0)
signal strength 1 of 5
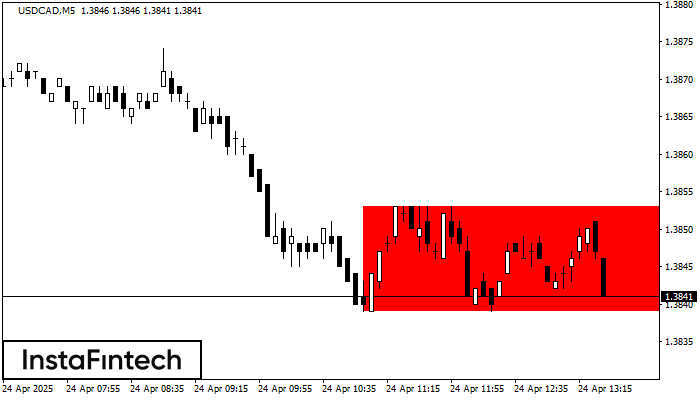
According to the chart of M5, USDCAD formed the Bearish Rectangle which is a pattern of a trend continuation. The pattern is contained within the following borders: lower border 1.3839
The M5 and M15 time frames may have more false entry points.
Open chart in a new window