Corak sebenar

Bearish Flag
was formed on 14.04 at 20:47:04 (UTC+0)
signal strength 3 of 5

The Bearish Flag pattern has been formed on EURJPY at M30. The lower boundary of the pattern is located at 162.05/162.27 while the upper boundary lies at 162.33/162.55. The projection of the flagpole is 88 points. This formation signals that the downward trend is most likely to continue. Therefore, if the level of 162.05 is broken, the price will move further downwards.
- All
- All
- Bearish Rectangle
- Bearish Symmetrical Triangle
- Bearish Symmetrical Triangle
- Bullish Rectangle
- Double Top
- Double Top
- Triple Bottom
- Triple Bottom
- Triple Top
- Triple Top
- All
- All
- Buy
- Sale
- All
- 1
- 2
- 3
- 4
- 5
डबल टॉप
was formed on 24.04 at 11:40:32 (UTC+0)
signal strength 1 of 5
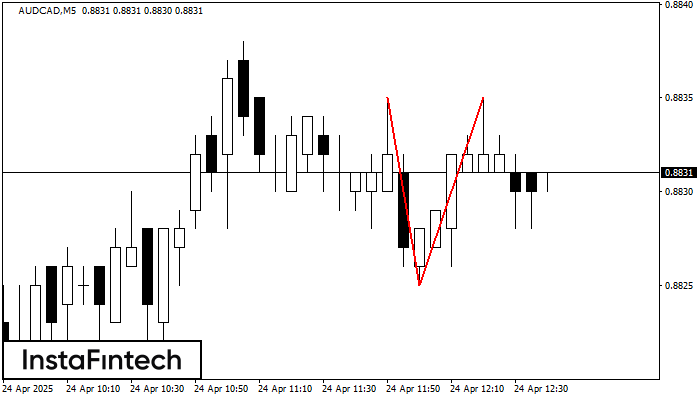
AUDCAD M5 के चार्ट पर डबल टॉप रीवर्सल पैटर्न बना है। विशेषताएं: ऊपरी सीमा 0.8835; निचली सीमा 0.8825; पैटर्न की चौड़ाई 10 पॉइंट्स। संकेत: निचली सीमा के टूटने से 0.8810
M5 और M15 समय सीमा में अधिक फाल्स एंट्री पॉइंट्स हो सकते हैं।
Open chart in a new window
डबल टॉप
was formed on 24.04 at 11:35:08 (UTC+0)
signal strength 1 of 5
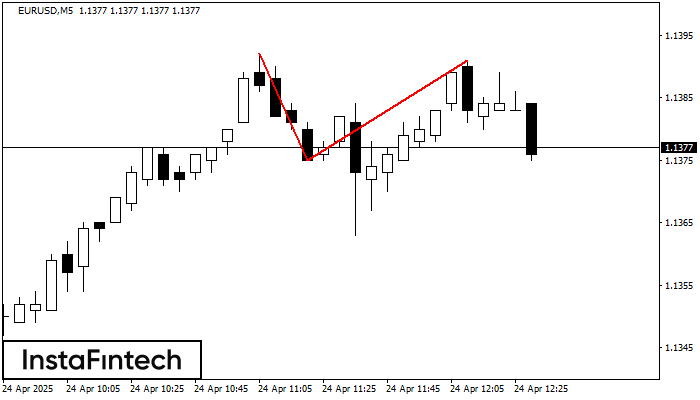
EURUSD M5 पर डबल टॉप रीवर्सल पैटर्न बना है। विशेषताएं: ऊपरी सीमा 1.1392; निचली सीमा 1.1375; पैटर्न की चौड़ाई 16 पॉइंट्स है। सेल ट्रेडों को 1.1375 की निचली सीमा के
M5 और M15 समय सीमा में अधिक फाल्स एंट्री पॉइंट्स हो सकते हैं।
Open chart in a new window
डबल बॉटम
was formed on 24.04 at 11:30:18 (UTC+0)
signal strength 1 of 5
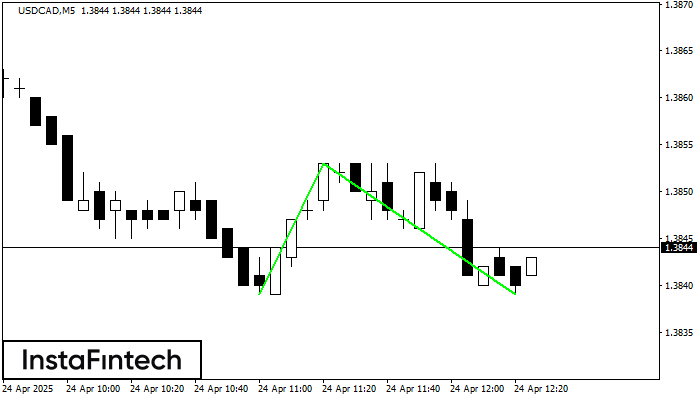
डबल बॉटम पैटर्न USDCAD M5 पर बना है; ऊपरी सीमा 1.3853 है; निचली सीमा 1.3839 है। पैटर्न की चौड़ाई 14 अंक है। ऊपरी सीमा 1.3853 के टूटने के मामले में
M5 और M15 समय सीमा में अधिक फाल्स एंट्री पॉइंट्स हो सकते हैं।
Open chart in a new window