Corak sebenar

Triple Top
was formed on 14.04 at 16:00:26 (UTC+0)
signal strength 4 of 5

The Triple Top pattern has formed on the chart of the EURJPY H1. Features of the pattern: borders have an ascending angle; the lower line of the pattern has the coordinates 161.49/162.07 with the upper limit 163.10/163.14; the projection of the width is 161 points. The formation of the Triple Top figure most likely indicates a change in the trend from upward to downward. This means that in the event of a breakdown of the support level of 161.49, the price is most likely to continue the downward movement.
- All
- All
- Bearish Rectangle
- Bearish Symmetrical Triangle
- Bearish Symmetrical Triangle
- Bullish Rectangle
- Double Top
- Double Top
- Triple Bottom
- Triple Bottom
- Triple Top
- Triple Top
- All
- All
- Buy
- Sale
- All
- 1
- 2
- 3
- 4
- 5
Segi Tiga Simetri Menurun
was formed on 24.04 at 10:20:21 (UTC+0)
signal strength 1 of 5

Berdasarkan carta M5, GOLD membentuk corak Segi Tiga Simetri Menurun. Penerangan: Sempadan yang lebih rendah ialah 3314.14/3331.45 dan sempadan atas adalah 3343.45/3331.45. Lebar corak diukur pada carta pada -2931 pips
Carta masa M5 dan M15 mungkin mempunyai lebih banyak titik kemasukan palsu.
Open chart in a new window
Triple Bottom
was formed on 24.04 at 10:00:17 (UTC+0)
signal strength 4 of 5

Corak Triple Bottom telah dibentuk pada carta EURUSD H1. Ciri-ciri corak: Garisan bawah corak mempunyai koordinat 1.1439 dengan had atas 1.1439/1.1357, unjuran lebar adalah 131 mata. Pembentukan corak Triple Bottom
Open chart in a new window
Segi Empat Menaik
was formed on 24.04 at 09:19:04 (UTC+0)
signal strength 3 of 5
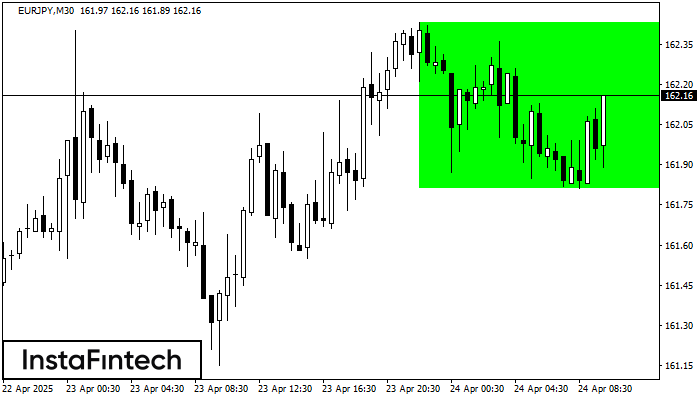
Berdasarkan carta M30, EURJPY telah membentuk Segi Empat Menaik. Corak ini menunjukkan kesinambungan aliran. Sempadan atas adalah 162.43, sempadan bawah adalah 161.81. Isyarat bermakna bahawa kedudukan panjang perlu dibuka
Open chart in a new window