Corak sebenar

Bearish Symmetrical Triangle
was formed on 08.04 at 01:02:26 (UTC+0)
signal strength 1 of 5
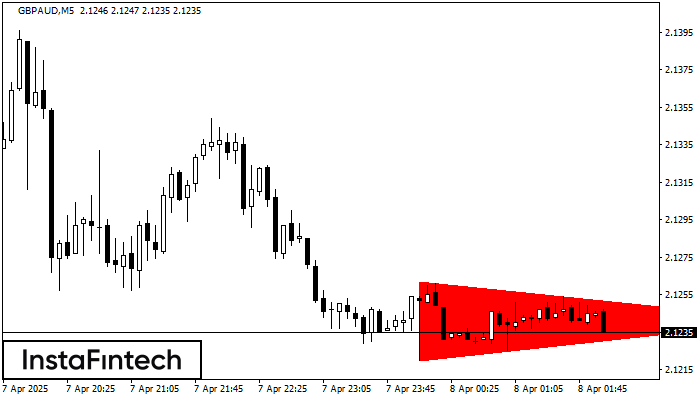
According to the chart of M5, GBPAUD formed the Bearish Symmetrical Triangle pattern. This pattern signals a further downward trend in case the lower border 2.1220 is breached. Here, a hypothetical profit will equal the width of the available pattern that is -42 pips.
The M5 and M15 time frames may have more false entry points.
Juga lihat
- All
- All
- Bearish Rectangle
- Bearish Symmetrical Triangle
- Bearish Symmetrical Triangle
- Bullish Rectangle
- Double Top
- Double Top
- Triple Bottom
- Triple Bottom
- Triple Top
- Triple Top
- All
- All
- Buy
- Sale
- All
- 1
- 2
- 3
- 4
- 5
Triple Bottom
was formed on 17.04 at 13:35:08 (UTC+0)
signal strength 1 of 5
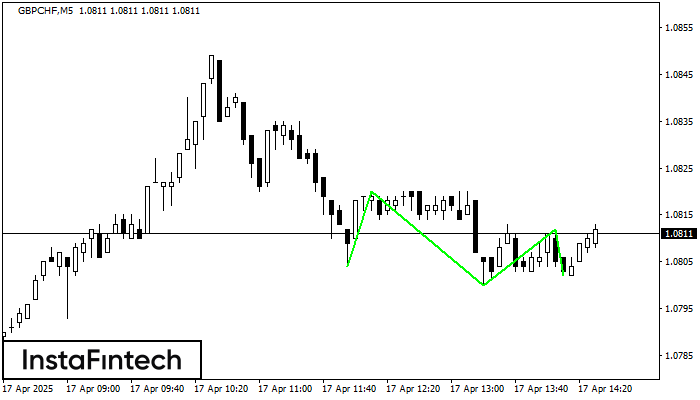
The Triple Bottom pattern has formed on the chart of GBPCHF M5. Features of the pattern: The lower line of the pattern has coordinates 1.0820 with the upper limit 1.0820/1.0812
The M5 and M15 time frames may have more false entry points.
Open chart in a new window
Double Top
was formed on 17.04 at 12:14:50 (UTC+0)
signal strength 1 of 5

The Double Top pattern has been formed on GBPUSD M5. It signals that the trend has been changed from upwards to downwards. Probably, if the base of the pattern 1.3238
The M5 and M15 time frames may have more false entry points.
Open chart in a new window
Head and Shoulders
was formed on 17.04 at 11:25:05 (UTC+0)
signal strength 1 of 5

The GBPAUD M5 formed the Head and Shoulders pattern with the following features: The Head’s top is at 2.0878, the Neckline and the upward angle are at 2.0820/2.0825. The formation
The M5 and M15 time frames may have more false entry points.
Open chart in a new window