

Corak sebenar

Bullish Rectangle
was formed on 07.04 at 14:00:04 (UTC+0)
signal strength 1 of 5
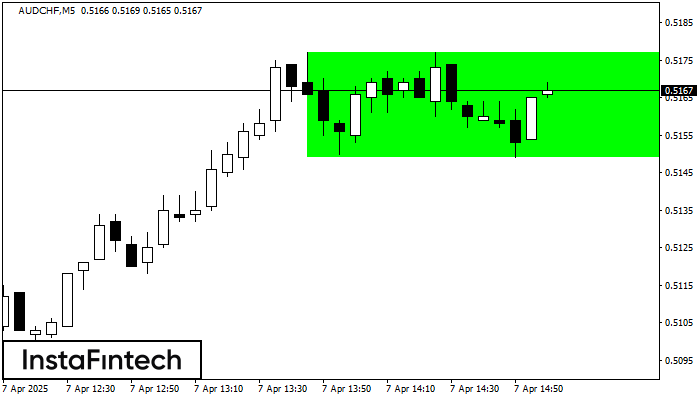
According to the chart of M5, AUDCHF formed the Bullish Rectangle. This type of a pattern indicates a trend continuation. It consists of two levels: resistance 0.5177 and support 0.5149. In case the resistance level 0.5177 - 0.5177 is broken, the instrument is likely to follow the bullish trend.
The M5 and M15 time frames may have more false entry points.
- All
- All
- Bearish Rectangle
- Bearish Symmetrical Triangle
- Bearish Symmetrical Triangle
- Bullish Rectangle
- Double Top
- Double Top
- Triple Bottom
- Triple Bottom
- Triple Top
- Triple Top
- All
- All
- Buy
- Sale
- All
- 1
- 2
- 3
- 4
- 5
Triple Top
was formed on 23.04 at 02:15:05 (UTC+0)
signal strength 1 of 5

On the chart of the AUDJPY M5 trading instrument, the Triple Top pattern that signals a trend change has formed. It is possible that after formation of the third peak
The M5 and M15 time frames may have more false entry points.
Open chart in a new window
Double Top
was formed on 23.04 at 02:15:05 (UTC+0)
signal strength 1 of 5
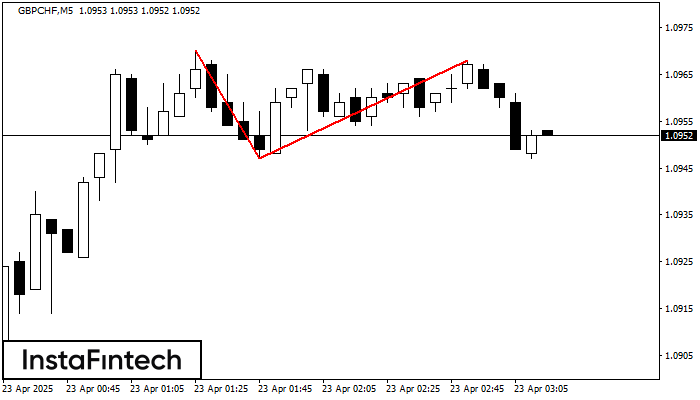
On the chart of GBPCHF M5 the Double Top reversal pattern has been formed. Characteristics: the upper boundary 1.0968; the lower boundary 1.0947; the width of the pattern 21 points
The M5 and M15 time frames may have more false entry points.
Open chart in a new window
Triple Bottom
was formed on 23.04 at 02:10:12 (UTC+0)
signal strength 1 of 5
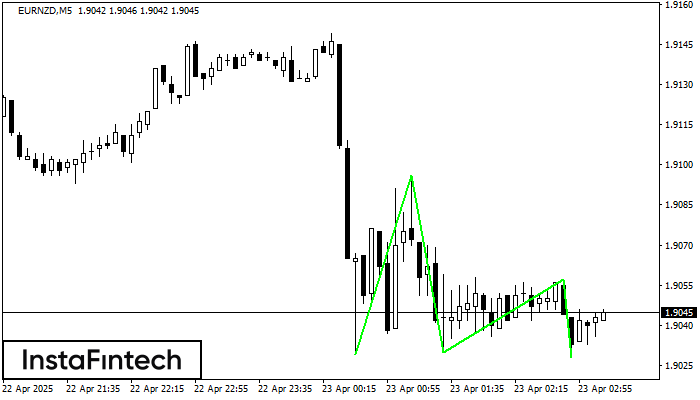
The Triple Bottom pattern has been formed on EURNZD M5. It has the following characteristics: resistance level 1.9096/1.9057; support level 1.9029/1.9028; the width is 67 points. In the event
The M5 and M15 time frames may have more false entry points.
Open chart in a new window

