Corak sebenar

Double Top
was formed on 04.04 at 21:55:03 (UTC+0)
signal strength 1 of 5
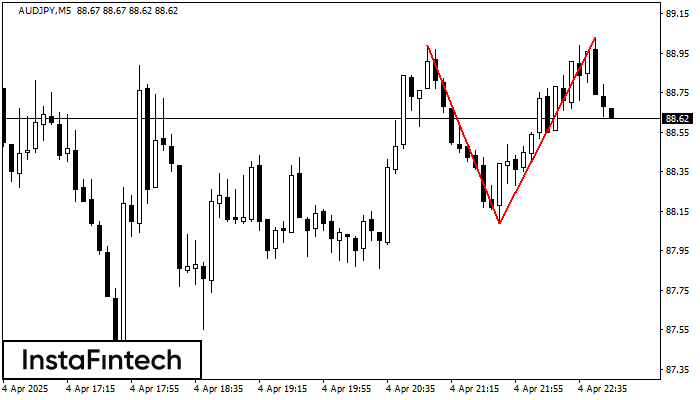
The Double Top pattern has been formed on AUDJPY M5. It signals that the trend has been changed from upwards to downwards. Probably, if the base of the pattern 88.09 is broken, the downward movement will continue.
The M5 and M15 time frames may have more false entry points.
Juga lihat
- All
- All
- Bearish Rectangle
- Bearish Symmetrical Triangle
- Bearish Symmetrical Triangle
- Bullish Rectangle
- Double Top
- Double Top
- Triple Bottom
- Triple Bottom
- Triple Top
- Triple Top
- All
- All
- Buy
- Sale
- All
- 1
- 2
- 3
- 4
- 5
Bearish Flag
was formed on 17.04 at 18:36:16 (UTC+0)
signal strength 5 of 5
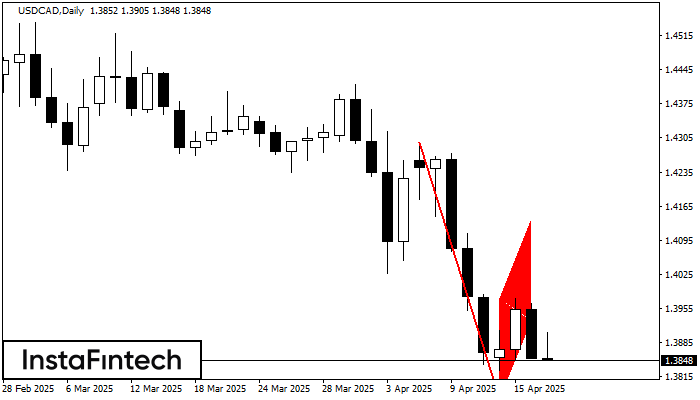
The Bearish Flag pattern has been formed on the chart USDCAD D1 which signals that the downward trend will continue. If the price breaks below the low at 1.3767, then
Open chart in a new window
Bearish pennant
was formed on 17.04 at 18:36:12 (UTC+0)
signal strength 5 of 5
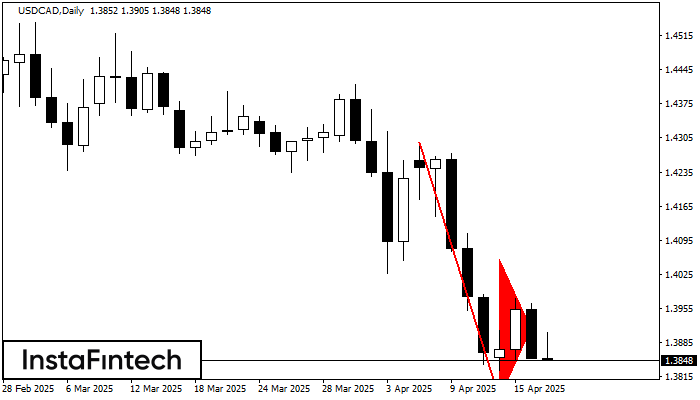
The Bearish pennant pattern has formed on the USDCAD D1 chart. It signals potential continuation of the existing trend. Specifications: the pattern’s bottom has the coordinate of 1.3767; the projection
Open chart in a new window
Double Top
was formed on 17.04 at 18:15:13 (UTC+0)
signal strength 1 of 5
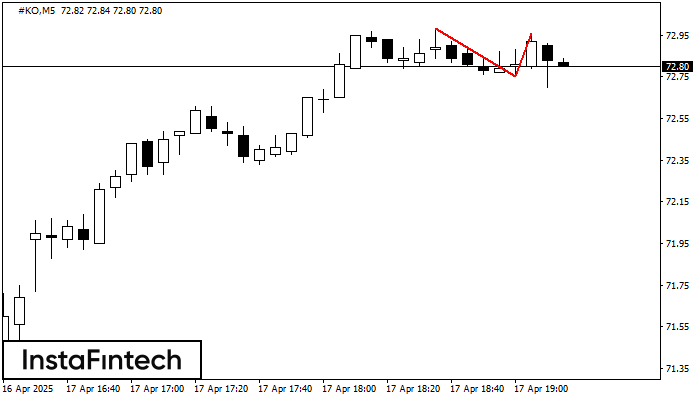
On the chart of #KO M5 the Double Top reversal pattern has been formed. Characteristics: the upper boundary 72.96; the lower boundary 72.75; the width of the pattern 21 points
The M5 and M15 time frames may have more false entry points.
Open chart in a new window