Corak sebenar

Bullish Symmetrical Triangle
was formed on 04.04 at 05:20:08 (UTC+0)
signal strength 1 of 5

According to the chart of M5, #Bitcoin formed the Bullish Symmetrical Triangle pattern. Description: This is the pattern of a trend continuation. 83376.14 and 82331.42 are the coordinates of the upper and lower borders respectively. The pattern width is measured on the chart at 104472 pips. Outlook: If the upper border 83376.14 is broken, the price is likely to continue its move by 82907.57.
The M5 and M15 time frames may have more false entry points.
- All
- All
- Bearish Rectangle
- Bearish Symmetrical Triangle
- Bearish Symmetrical Triangle
- Bullish Rectangle
- Double Top
- Double Top
- Triple Bottom
- Triple Bottom
- Triple Top
- Triple Top
- All
- All
- Buy
- Sale
- All
- 1
- 2
- 3
- 4
- 5
डबल टॉप
was formed on 24.04 at 11:40:32 (UTC+0)
signal strength 1 of 5
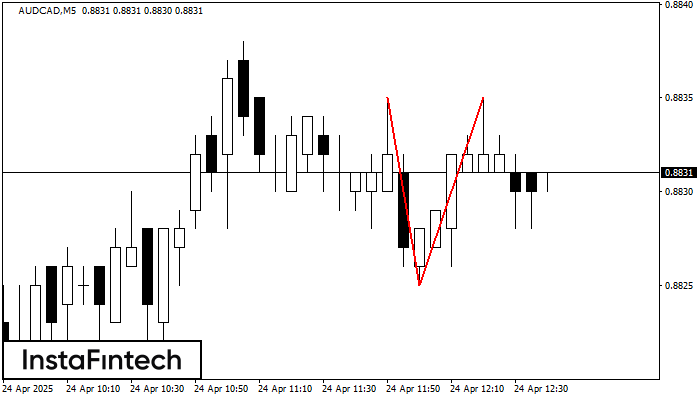
AUDCAD M5 के चार्ट पर डबल टॉप रीवर्सल पैटर्न बना है। विशेषताएं: ऊपरी सीमा 0.8835; निचली सीमा 0.8825; पैटर्न की चौड़ाई 10 पॉइंट्स। संकेत: निचली सीमा के टूटने से 0.8810
M5 और M15 समय सीमा में अधिक फाल्स एंट्री पॉइंट्स हो सकते हैं।
Open chart in a new window
डबल टॉप
was formed on 24.04 at 11:35:08 (UTC+0)
signal strength 1 of 5
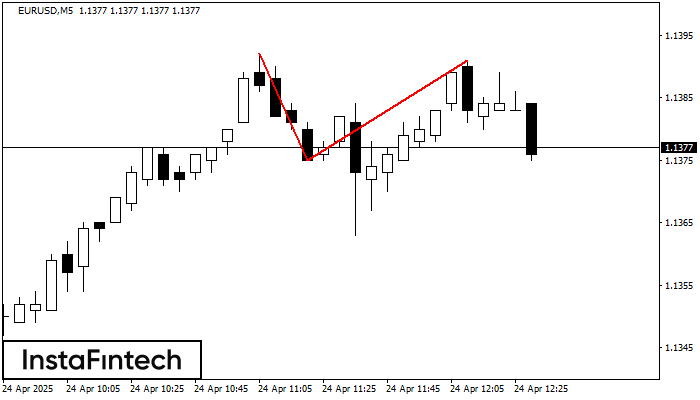
EURUSD M5 पर डबल टॉप रीवर्सल पैटर्न बना है। विशेषताएं: ऊपरी सीमा 1.1392; निचली सीमा 1.1375; पैटर्न की चौड़ाई 16 पॉइंट्स है। सेल ट्रेडों को 1.1375 की निचली सीमा के
M5 और M15 समय सीमा में अधिक फाल्स एंट्री पॉइंट्स हो सकते हैं।
Open chart in a new window
डबल बॉटम
was formed on 24.04 at 11:30:18 (UTC+0)
signal strength 1 of 5
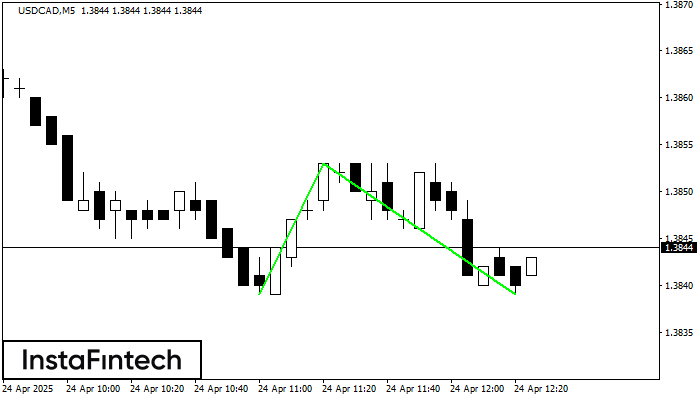
डबल बॉटम पैटर्न USDCAD M5 पर बना है; ऊपरी सीमा 1.3853 है; निचली सीमा 1.3839 है। पैटर्न की चौड़ाई 14 अंक है। ऊपरी सीमा 1.3853 के टूटने के मामले में
M5 और M15 समय सीमा में अधिक फाल्स एंट्री पॉइंट्स हो सकते हैं।
Open chart in a new window