Corak sebenar

Bullish Symmetrical Triangle
was formed on 02.04 at 18:07:59 (UTC+0)
signal strength 1 of 5
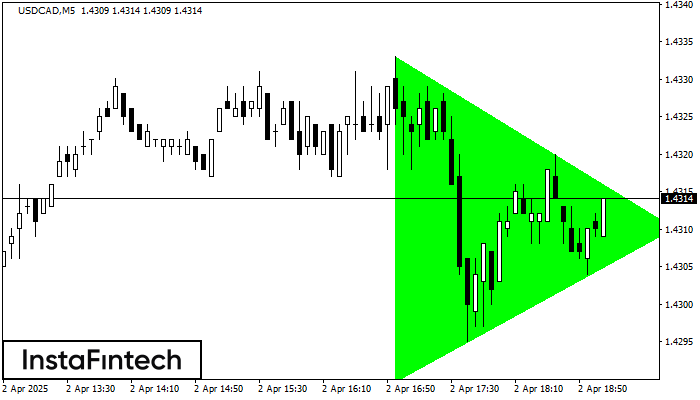
According to the chart of M5, USDCAD formed the Bullish Symmetrical Triangle pattern. Description: This is the pattern of a trend continuation. 1.4333 and 1.4290 are the coordinates of the upper and lower borders respectively. The pattern width is measured on the chart at 43 pips. Outlook: If the upper border 1.4333 is broken, the price is likely to continue its move by 1.4325.
The M5 and M15 time frames may have more false entry points.
- All
- All
- Bearish Rectangle
- Bearish Symmetrical Triangle
- Bearish Symmetrical Triangle
- Bullish Rectangle
- Double Top
- Double Top
- Triple Bottom
- Triple Bottom
- Triple Top
- Triple Top
- All
- All
- Buy
- Sale
- All
- 1
- 2
- 3
- 4
- 5
Triple Bottom
was formed on 23.04 at 20:00:49 (UTC+0)
signal strength 1 of 5
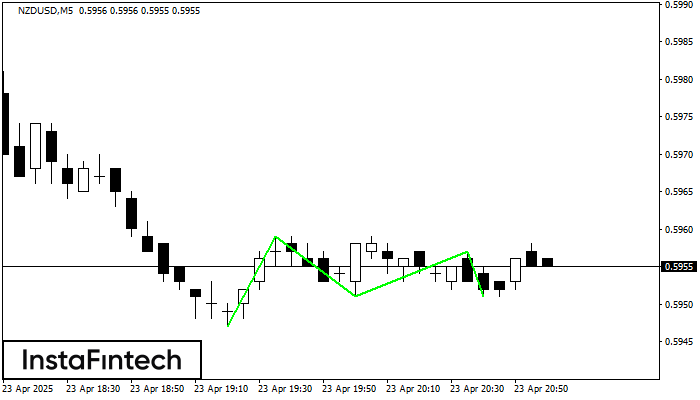
Corak Triple Bottom telah dibentuk pada NZDUSD M5. Ia mempunyai ciri-ciri berikut: tahap rintangan 0.5959/0.5957; tahap sokongan 0.5947/0.5951; lebar corak adalah 12 mata. Dalam situasi penembusan paras rintangan 0.5959, harga
Carta masa M5 dan M15 mungkin mempunyai lebih banyak titik kemasukan palsu.
Open chart in a new window
Double Bottom
was formed on 23.04 at 20:00:30 (UTC+0)
signal strength 1 of 5
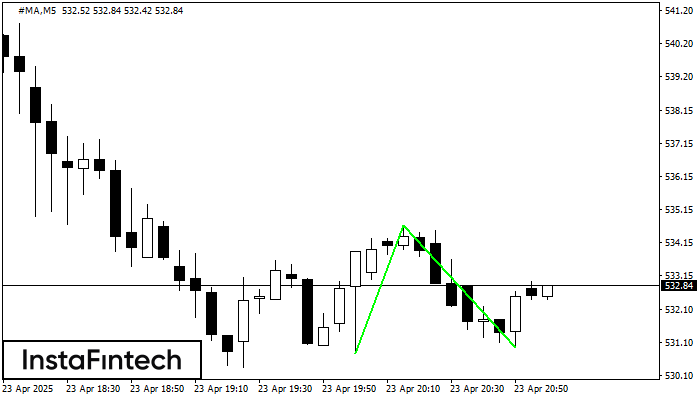
Corak Double Bottom telah dibentuk pada #MA M5. Pembentukan ini menandakan pembalikan aliran dari aliran menurun ke atas. Isyarat ialah perdagangan membeli harus dibuka selepas sempadan atas corak 534.66 telah
Carta masa M5 dan M15 mungkin mempunyai lebih banyak titik kemasukan palsu.
Open chart in a new window
Pennant Aliran Menaik
was formed on 23.04 at 20:00:19 (UTC+0)
signal strength 3 of 5
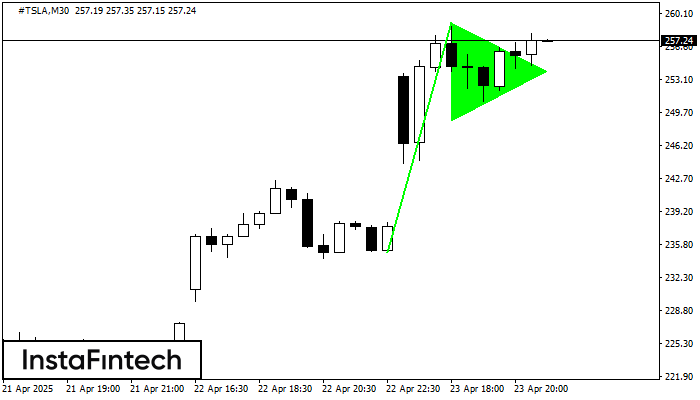
Corak grafik Pennant Aliran Menaik telah terbentuk pada instrumen #TSLA M30. Jenis corak ini berada di bawah kategori corak kesinambungan. Dalam situasi ini, sekiranya penetapan harga boleh menembusi tinggi, adalah
Open chart in a new window