Corak sebenar

Double Bottom
was formed on 02.04 at 14:31:58 (UTC+0)
signal strength 2 of 5
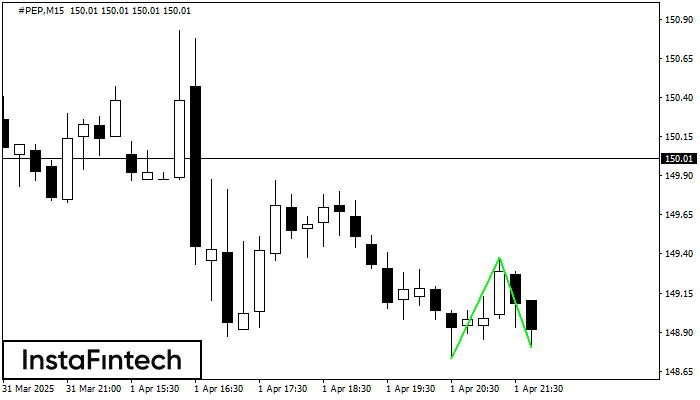
The Double Bottom pattern has been formed on #PEP M15; the upper boundary is 149.38; the lower boundary is 148.80. The width of the pattern is 65 points. In case of a break of the upper boundary 149.38, a change in the trend can be predicted where the width of the pattern will coincide with the distance to a possible take profit level.
The M5 and M15 time frames may have more false entry points.
Juga lihat
- All
- All
- Bearish Rectangle
- Bearish Symmetrical Triangle
- Bearish Symmetrical Triangle
- Bullish Rectangle
- Double Top
- Double Top
- Triple Bottom
- Triple Bottom
- Triple Top
- Triple Top
- All
- All
- Buy
- Sale
- All
- 1
- 2
- 3
- 4
- 5
Head and Shoulders
was formed on 17.04 at 14:00:03 (UTC+0)
signal strength 2 of 5

The technical pattern called Head and Shoulders has appeared on the chart of EURCHF M15. There are weighty reasons to suggest that the price will surpass the Neckline 0.9278/0.9279 after
The M5 and M15 time frames may have more false entry points.
Open chart in a new window
Bearish Symmetrical Triangle
was formed on 17.04 at 13:58:48 (UTC+0)
signal strength 1 of 5

According to the chart of M5, GBPUSD formed the Bearish Symmetrical Triangle pattern. Trading recommendations: A breach of the lower border 1.3203 is likely to encourage a continuation
The M5 and M15 time frames may have more false entry points.
Open chart in a new window
Bearish Symmetrical Triangle
was formed on 17.04 at 13:57:41 (UTC+0)
signal strength 3 of 5

According to the chart of M30, EURUSD formed the Bearish Symmetrical Triangle pattern. This pattern signals a further downward trend in case the lower border 1.1264 is breached. Here
Open chart in a new window