Corak sebenar

Bullish Rectangle
was formed on 02.04 at 05:02:20 (UTC+0)
signal strength 1 of 5
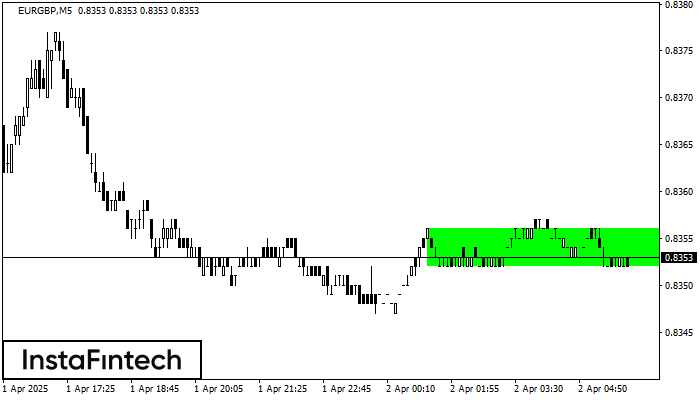
According to the chart of M5, EURGBP formed the Bullish Rectangle. The pattern indicates a trend continuation. The upper border is 0.8356, the lower border is 0.8352. The signal means that a long position should be opened above the upper border 0.8356 of the Bullish Rectangle.
The M5 and M15 time frames may have more false entry points.
Juga lihat
- All
- All
- Bearish Rectangle
- Bearish Symmetrical Triangle
- Bearish Symmetrical Triangle
- Bullish Rectangle
- Double Top
- Double Top
- Triple Bottom
- Triple Bottom
- Triple Top
- Triple Top
- All
- All
- Buy
- Sale
- All
- 1
- 2
- 3
- 4
- 5
Double Bottom
was formed on 14.04 at 22:00:04 (UTC+0)
signal strength 3 of 5
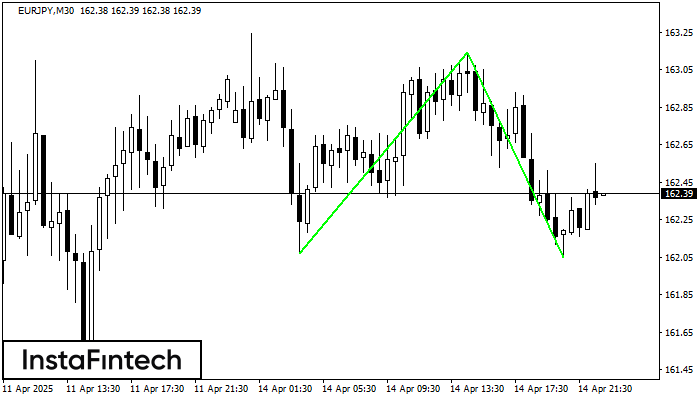
The Double Bottom pattern has been formed on EURJPY M30; the upper boundary is 163.14; the lower boundary is 162.05. The width of the pattern is 107 points. In case
Open chart in a new window
Double Bottom
was formed on 14.04 at 22:00:04 (UTC+0)
signal strength 1 of 5
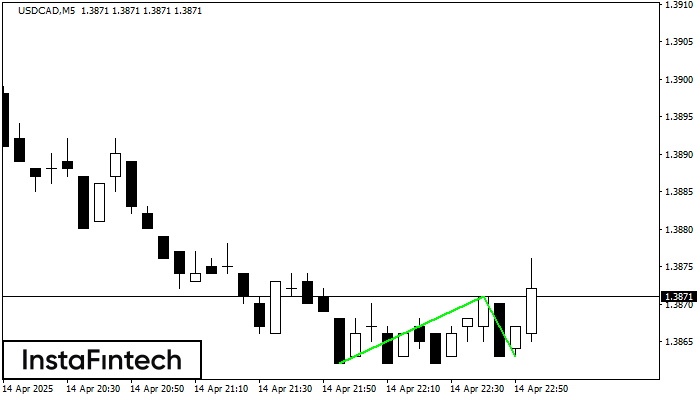
The Double Bottom pattern has been formed on USDCAD M5. Characteristics: the support level 1.3862; the resistance level 1.3871; the width of the pattern 9 points. If the resistance level
The M5 and M15 time frames may have more false entry points.
Open chart in a new window
Bearish Symmetrical Triangle
was formed on 14.04 at 21:53:03 (UTC+0)
signal strength 1 of 5
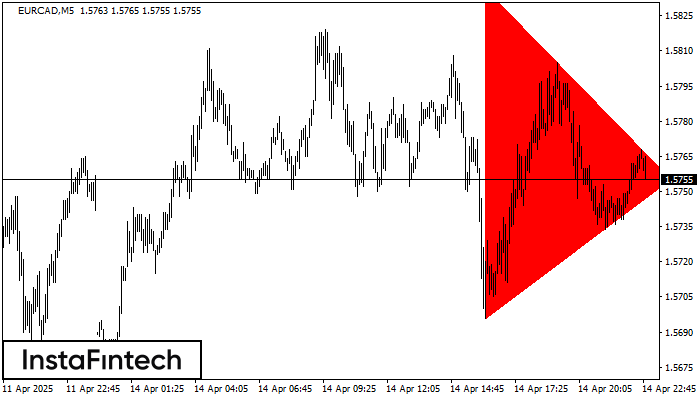
According to the chart of M5, EURCAD formed the Bearish Symmetrical Triangle pattern. This pattern signals a further downward trend in case the lower border 1.5696 is breached. Here
The M5 and M15 time frames may have more false entry points.
Open chart in a new window