Corak sebenar

Bullish Symmetrical Triangle
was formed on 31.03 at 13:59:41 (UTC+0)
signal strength 1 of 5
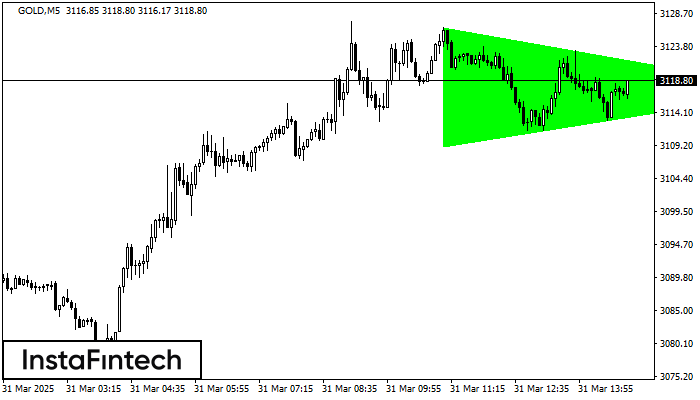
According to the chart of M5, GOLD formed the Bullish Symmetrical Triangle pattern. The lower border of the pattern touches the coordinates 3109.07/3117.44 whereas the upper border goes across 3126.71/3117.44. If the Bullish Symmetrical Triangle pattern is in progress, this evidently signals a further upward trend. In other words, in case the scenario comes true, the price of GOLD will breach the upper border to head for 3117.59.
The M5 and M15 time frames may have more false entry points.
- All
- All
- Bearish Rectangle
- Bearish Symmetrical Triangle
- Bearish Symmetrical Triangle
- Bullish Rectangle
- Double Top
- Double Top
- Triple Bottom
- Triple Bottom
- Triple Top
- Triple Top
- All
- All
- Buy
- Sale
- All
- 1
- 2
- 3
- 4
- 5
Triple Top
was formed on 25.04 at 08:30:10 (UTC+0)
signal strength 1 of 5
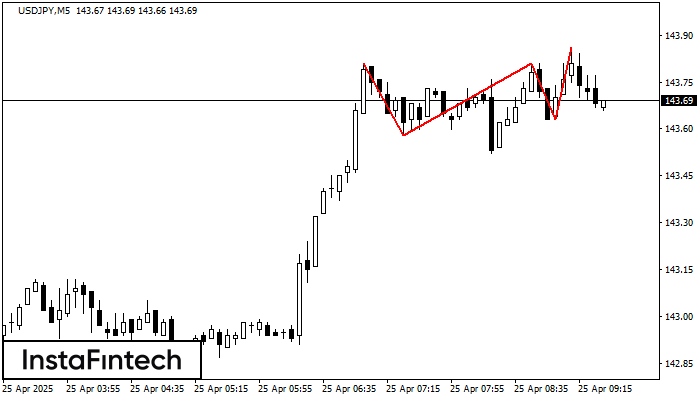
Pada carta instrumen dagangan USDJPY M5, corak Triple Top yang menandakan perubahan aliran telah terbentuk. Adalah mungkin bahawa selepas pembentukan bahagian atas ketiga, harga akan cuba menembusi tahap rintangan 143.58
Carta masa M5 dan M15 mungkin mempunyai lebih banyak titik kemasukan palsu.
Open chart in a new window
Inverse Head dan Shoulder
was formed on 25.04 at 08:30:00 (UTC+0)
signal strength 2 of 5
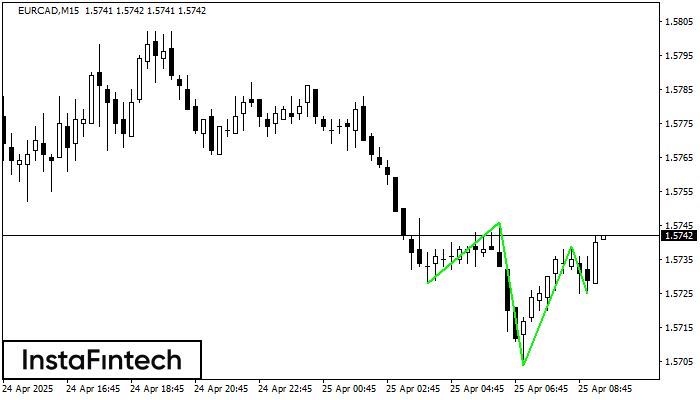
According to M15, EURCAD is shaping the technical pattern – the Inverse Head dan Shoulder. In case the Neckline 1.5746/1.5739 is broken out, the instrument is likely to move toward
Carta masa M5 dan M15 mungkin mempunyai lebih banyak titik kemasukan palsu.
Open chart in a new window
Triple Bottom
was formed on 25.04 at 07:41:10 (UTC+0)
signal strength 1 of 5
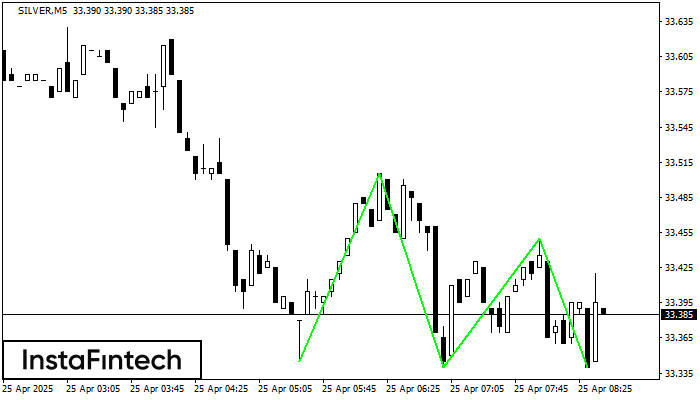
Corak Triple Bottom telah dibentuk pada SILVER M5. Ia mempunyai ciri-ciri berikut: tahap rintangan 33.51/33.45; tahap sokongan 33.34/33.34; lebar corak adalah 160 mata. Dalam situasi penembusan paras rintangan 33.51, harga
Carta masa M5 dan M15 mungkin mempunyai lebih banyak titik kemasukan palsu.
Open chart in a new window