Corak sebenar

Double Bottom
was formed on 26.03 at 06:00:22 (UTC+0)
signal strength 2 of 5
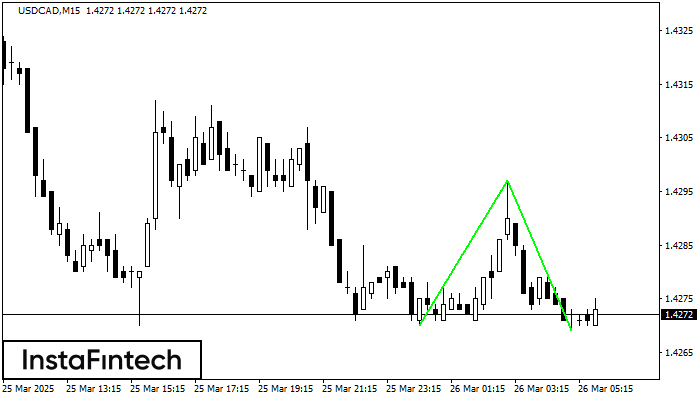
The Double Bottom pattern has been formed on USDCAD M15; the upper boundary is 1.4297; the lower boundary is 1.4269. The width of the pattern is 27 points. In case of a break of the upper boundary 1.4297, a change in the trend can be predicted where the width of the pattern will coincide with the distance to a possible take profit level.
The M5 and M15 time frames may have more false entry points.
Juga lihat
- All
- All
- Bearish Rectangle
- Bearish Symmetrical Triangle
- Bearish Symmetrical Triangle
- Bullish Rectangle
- Double Top
- Double Top
- Triple Bottom
- Triple Bottom
- Triple Top
- Triple Top
- All
- All
- Buy
- Sale
- All
- 1
- 2
- 3
- 4
- 5
Double Top
was formed on 11.04 at 18:30:14 (UTC+0)
signal strength 1 of 5
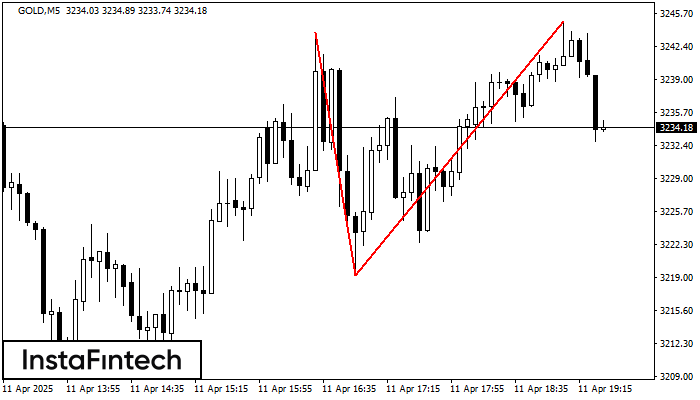
The Double Top reversal pattern has been formed on GOLD M5. Characteristics: the upper boundary 3243.80; the lower boundary 3219.16; the width of the pattern is 2574 points. Sell trades
The M5 and M15 time frames may have more false entry points.
Open chart in a new window
Double Top
was formed on 11.04 at 18:30:14 (UTC+0)
signal strength 2 of 5
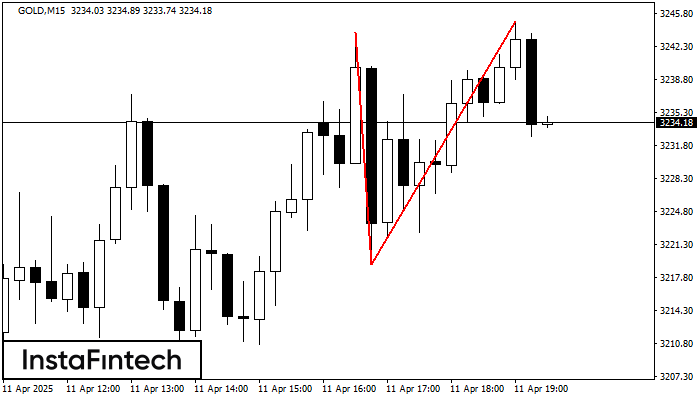
The Double Top reversal pattern has been formed on GOLD M15. Characteristics: the upper boundary 3243.80; the lower boundary 3219.16; the width of the pattern is 2574 points. Sell trades
The M5 and M15 time frames may have more false entry points.
Open chart in a new window
Bearish Rectangle
was formed on 11.04 at 18:25:14 (UTC+0)
signal strength 1 of 5
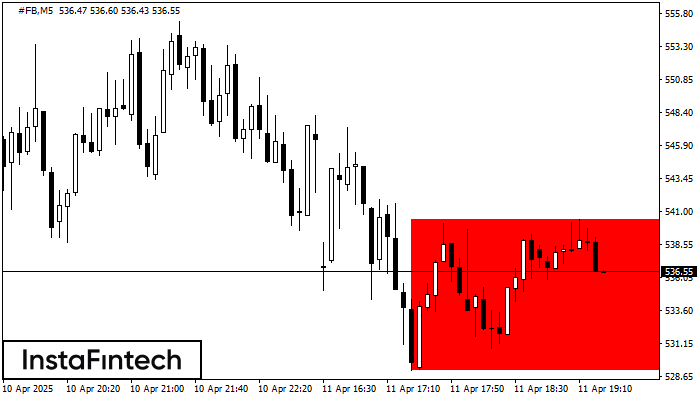
According to the chart of M5, #FB formed the Bearish Rectangle which is a pattern of a trend continuation. The pattern is contained within the following borders: lower border 529.17
The M5 and M15 time frames may have more false entry points.
Open chart in a new window