Corak sebenar

Bearish Rectangle
was formed on 21.03 at 22:23:03 (UTC+0)
signal strength 2 of 5

According to the chart of M15, EURCHF formed the Bearish Rectangle which is a pattern of a trend continuation. The pattern is contained within the following borders: lower border 0.9539 – 0.9539 and upper border 0.9558 – 0.9558. In case the lower border is broken, the instrument is likely to follow the downward trend.
The M5 and M15 time frames may have more false entry points.
- All
- All
- Bearish Rectangle
- Bearish Symmetrical Triangle
- Bearish Symmetrical Triangle
- Bullish Rectangle
- Double Top
- Double Top
- Triple Bottom
- Triple Bottom
- Triple Top
- Triple Top
- All
- All
- Buy
- Sale
- All
- 1
- 2
- 3
- 4
- 5
Double Bottom
was formed on 11.04 at 19:00:41 (UTC+0)
signal strength 3 of 5
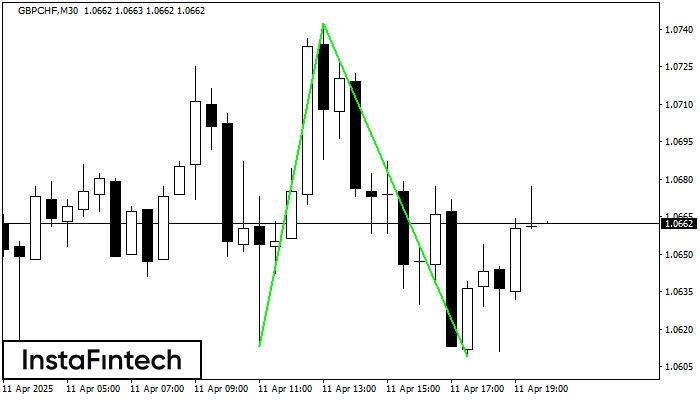
The Double Bottom pattern has been formed on GBPCHF M30. This formation signals a reversal of the trend from downwards to upwards. The signal is that a buy trade should
Open chart in a new window
Double Top
was formed on 11.04 at 18:30:14 (UTC+0)
signal strength 1 of 5
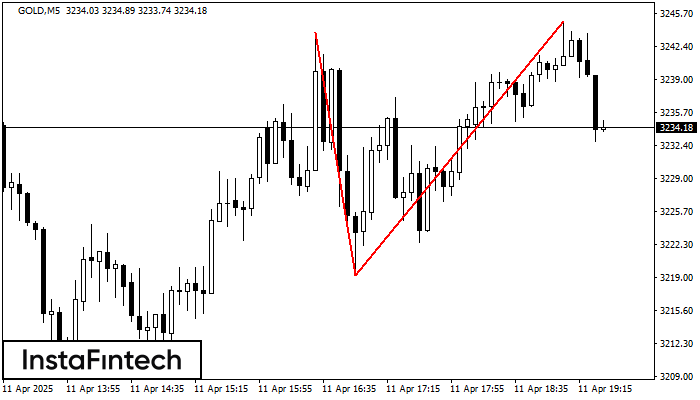
The Double Top reversal pattern has been formed on GOLD M5. Characteristics: the upper boundary 3243.80; the lower boundary 3219.16; the width of the pattern is 2574 points. Sell trades
The M5 and M15 time frames may have more false entry points.
Open chart in a new window
Double Top
was formed on 11.04 at 18:30:14 (UTC+0)
signal strength 2 of 5
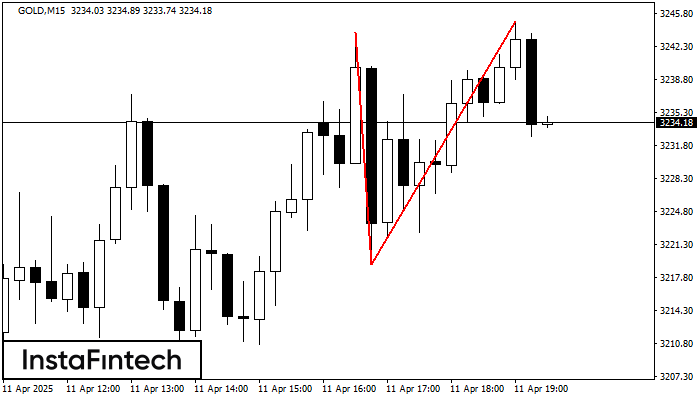
The Double Top reversal pattern has been formed on GOLD M15. Characteristics: the upper boundary 3243.80; the lower boundary 3219.16; the width of the pattern is 2574 points. Sell trades
The M5 and M15 time frames may have more false entry points.
Open chart in a new window