Lihat juga


 24.03.2023 10:21 AM
At a monetary policy meeting yesterday, the Bank of England raised interest rates by 25 basis points to 4.25%, the highest rates since October 2008. Back then, interest rates were at 4.50%. The increase came due to persistent inflation. In February and January, consumer prices accelerated to 10.4% and 10.1% respectively. Meanwhile, economists had expected inflation to slow down in February. However, the latest press release hints at a possible end of the tightening cycle in the near term. So, it may be that we will soon see the regulator pause tightening.
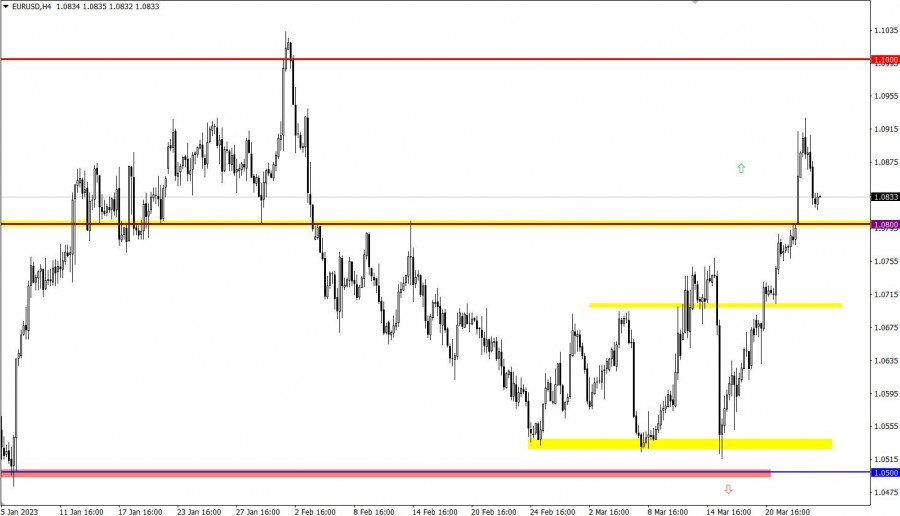
EUR/USD has gained over 250 pips since the beginning of the week. That triggered a horizontal movement with a signal to buy EUR. The volume of long positions decreased and the price retreated.
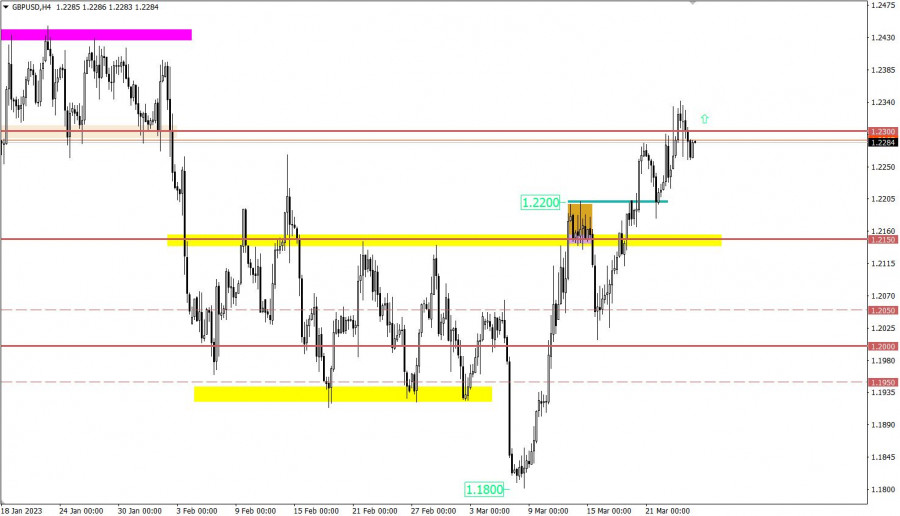
Once 1.2300 resistance was reached, GBP/USD pulled back somewhat. Nevertheless, the bull trend goes on. The pound has recouped almost all losses incurred in February.
With the opening of European trade, UK retail sales came in, showing a rise to -3.5% versus -5.4% year-on-year. On a monthly basis, figures grew by 1.2%.
Today, a series of business activity reports will be delivered in the eurozone, the United States, and the United Kingdom. Economists expect figures to decline across the board.
EUR/USD retreated to 1.0800 support. The price may rebound from this mark with a rise in buying volumes.
Alternatively, EUR/USD may go down if quotes stay below 1.0800 intraday.
A pullback may cause a shift in sentiment. Should the price go above 1.2300, it would generate a signal to buy GBP. This could lead to a bullish continuation, and the pair could update the swing high of the medium-term trend.
Alternatively, if quotes fall below 1.2200, it will mark the rise of a downtrend.
The candlestick chart shows graphical white and black rectangles with upward and downward lines. While conducting a detailed analysis of each individual candlestick, it is possible to notice its features intrinsic to a particular time frame: the opening price, the closing price, and the highest and lowest price.
Horizontal levels are price levels, in relation to which a stop or reversal of the price may occur. They are called support and resistance levels.
Circles and rectangles are highlighted examples where the price reversed in the course of its history. This color highlighting indicates horizontal lines which can exert pressure on prices in the future.
Upward/downward arrows signal a possible future price direction.
You have already liked this post today
* Analisis pasaran yang disiarkan di sini adalah bertujuan untuk meningkatkan kesedaran anda, tetapi tidak untuk memberi arahan untuk membuat perdagangan.
Pada hari Jumaat, pasangan mata wang GBP/USD juga tidak menunjukkan pergerakan yang menarik. Seperti euro, pound British kekal sangat hampir dengan julat mendatar. Walau bagaimanapun, mata wang British masih mengekalkan
Analisis Dagangan Hari Jumaat Carta 1-Jam pasangan EUR/USD Pasangan mata wang EUR/USD meneruskan dagangan secara mendatar pada hari Jumaat. Pasaran terus mengabaikan semua data makroekonomi, dan minggu lalu sekali lagi
Analisis GBP/USD carta 5-Minit Pasangan mata wang GBP/USD meneruskan dagangan mendatar pada hari Jumaat, kekal berhampiran paras tertinggi tiga tahun. Hakikat bahawa pound British enggan melakukan pembetulan menurun walaupun sedikit
Pasangan mata wang EUR/USD terus berdagang secara mendatar sepanjang hari Jumaat. Pada separuh kedua minggu lalu, euro berdagang semata-mata antara tahap 1.1321 dan 1.1391, walaupun saluran mendatar keseluruhannya boleh digariskan
Dalam ramalan pagi, saya memberi tumpuan pada paras 1.3310 dan merancang untuk membuat keputusan dagangan dari situ. Mari kita lihat carta 5-minit dan lihat apa yang berlaku. Kenaikan dan penembusan
Dalam ramalan pagi saya, saya menumpukan pada tahap 1.1391 dan merancang untuk membuat keputusan kemasukan sekitar tahap tersebut. Mari kita lihat carta 5 minit dan nilai apa yang telah berlaku
Analisis Dagangan Hari Khamis Carta 1 Jam pasangan GBP/USD Pasangan GBP/USD meneruskan dagangan dalam arah menaik pada hari Khamis meskipun tiada sebarang alasan objektif yang jelas untuk pergerakan tersebut. Tiada
Pada hari Khamis, pasangan mata wang EUR/USD didagangkan dengan sedikit kecenderungan menaik, walaupun akan lebih logik untuk melihat penurunan pada separuh kedua hari itu. Tiada peristiwa, laporan, atau pengumuman penting
Analisis 5-Minit pasangan GBP/USD Pada hari Khamis, pasangan mata wang GBP/USD meneruskan dagangan dalam "gaya euro." Pergerakan harian agak lemah, dan gambaran teknikal menunjukkan trend mungkin akan beralih ke bawah
Pasangan mata wang EUR/USD didagangkan dengan lebih tenang pada hari Khamis berbanding pada separuh pertama minggu ini, dan pasaran juga lebih bersifat teknikal. Sejak awal minggu, kami terus mengulang mesej
Your IP address shows that you are currently located in the USA. If you are a resident of the United States, you are prohibited from using the services of InstaFintech Group including online trading, online transfers, deposit/withdrawal of funds, etc.
If you think you are seeing this message by mistake and your location is not the US, kindly proceed to the website. Otherwise, you must leave the website in order to comply with government restrictions.
Why does your IP address show your location as the USA?
Please confirm whether you are a US resident or not by clicking the relevant button below. If you choose the wrong option, being a US resident, you will not be able to open an account with InstaTrade anyway.
We are sorry for any inconvenience caused by this message.


