Өзекті паттерндер

Двойная вершина
сформирован 15.04 в 02:30:41 (UTC+0)
сила сигнала 2 из 5
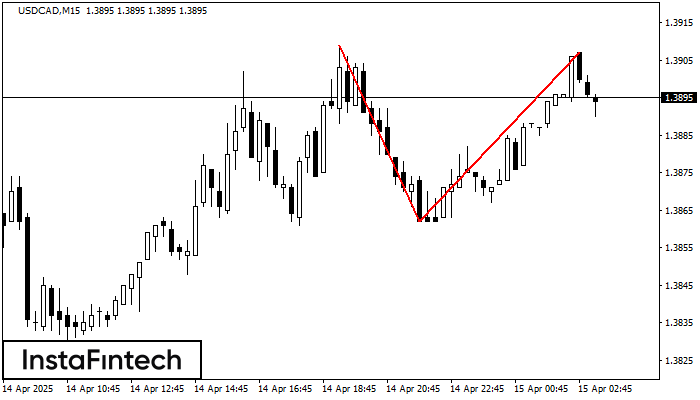
На торговом графике USDCAD M15 сформировалась разворотная фигура «Двойная вершина». Характеристика: Верхняя граница 1.3907; Нижняя граница 1.3862; Ширина фигуры 45 пунктов. Сигнал: Пробой нижней границы 1.3862 приведет к дальнейшему нисходящему движению с перспективой хода к уровню 1.3839.
Таймфреймы М5 и М15 могут иметь больше ложных точек входа.
Сондай-ақ қараңыз
- Все
- Все
- Bearish Rectangle
- Bearish Symmetrical Triangle
- Bearish Symmetrical Triangle
- Bullish Rectangle
- Double Top
- Double Top
- Triple Bottom
- Triple Bottom
- Triple Top
- Triple Top
- Все
- Все
- Покупка
- Продажа
- Все
- 1
- 2
- 3
- 4
- 5
Triple Bottom
was formed on 24.04 at 10:00:17 (UTC+0)
signal strength 4 of 5

The Triple Bottom pattern has formed on the chart of EURUSD H1. Features of the pattern: The lower line of the pattern has coordinates 1.1439 with the upper limit 1.1439/1.1357
Open chart in a new window
Bullish Rectangle
was formed on 24.04 at 09:19:04 (UTC+0)
signal strength 3 of 5
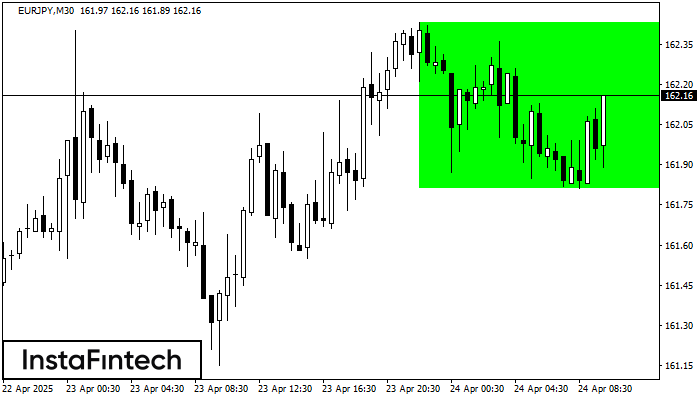
According to the chart of M30, EURJPY formed the Bullish Rectangle. The pattern indicates a trend continuation. The upper border is 162.43, the lower border is 161.81. The signal means
Open chart in a new window
Triple Bottom
was formed on 24.04 at 09:15:22 (UTC+0)
signal strength 1 of 5
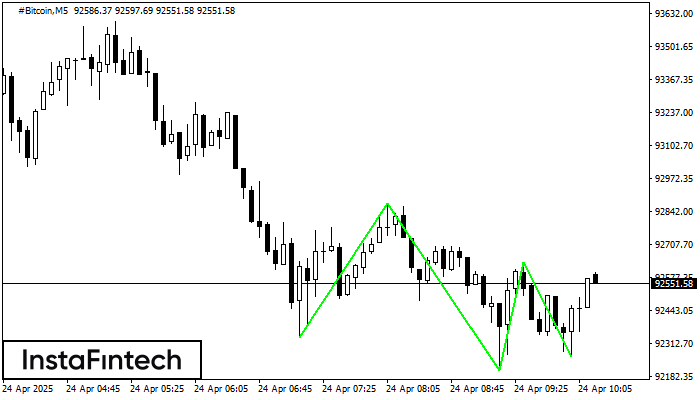
The Triple Bottom pattern has formed on the chart of #Bitcoin M5. Features of the pattern: The lower line of the pattern has coordinates 92871.00 with the upper limit 92871.00/92637.22
The M5 and M15 time frames may have more false entry points.
Open chart in a new window