Өзекті паттерндер

Бычий симметричный треугольник
сформирован 08.04 в 08:31:09 (UTC+0)
сила сигнала 1 из 5
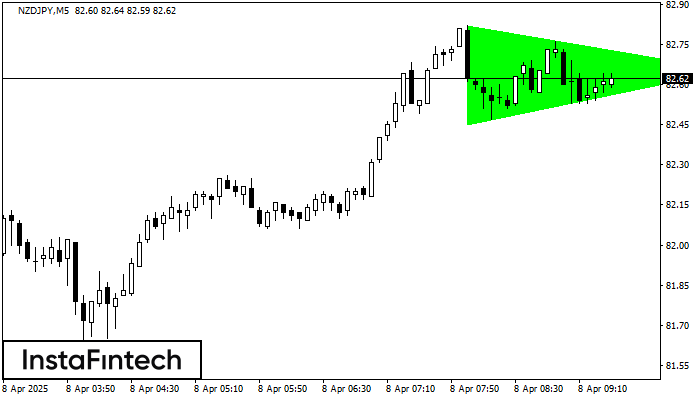
По NZDJPY на M5 фигура «Бычий симметричный треугольник». Характеристика: Фигура продолжения тренда; Координаты границ – верхняя 82.82, нижняя 82.45. Проекция ширины фигуры 37 пунктов. Прогноз: В случае пробоя верхней границы 82.82 цена, вероятнее всего, продолжит движение к 82.80.
Таймфреймы М5 и М15 могут иметь больше ложных точек входа.
- Все
- Все
- Bearish Rectangle
- Bearish Symmetrical Triangle
- Bearish Symmetrical Triangle
- Bullish Rectangle
- Double Top
- Double Top
- Triple Bottom
- Triple Bottom
- Triple Top
- Triple Top
- Все
- Все
- Покупка
- Продажа
- Все
- 1
- 2
- 3
- 4
- 5
Triple Top
was formed on 22.04 at 19:15:08 (UTC+0)
signal strength 1 of 5
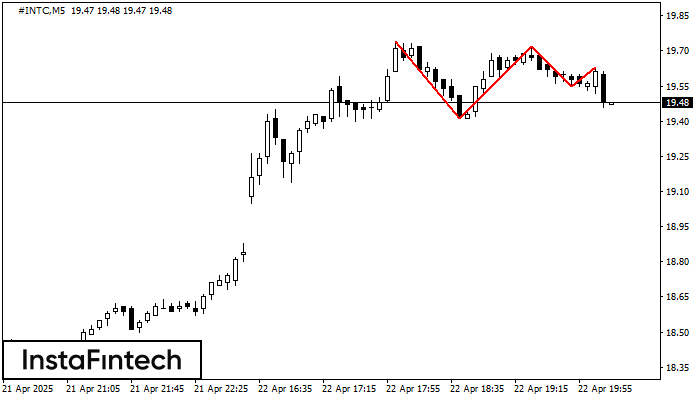
The Triple Top pattern has formed on the chart of the #INTC M5. Features of the pattern: borders have an ascending angle; the lower line of the pattern
The M5 and M15 time frames may have more false entry points.
Open chart in a new window
Double Top
was formed on 22.04 at 19:05:20 (UTC+0)
signal strength 1 of 5
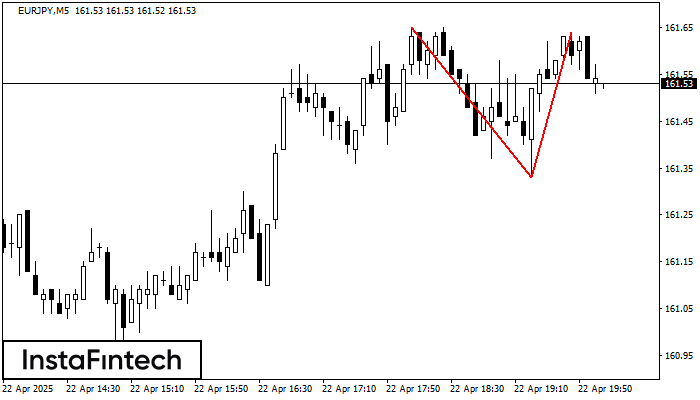
The Double Top pattern has been formed on EURJPY M5. It signals that the trend has been changed from upwards to downwards. Probably, if the base of the pattern 161.33
The M5 and M15 time frames may have more false entry points.
Open chart in a new window
Head and Shoulders
was formed on 22.04 at 19:00:29 (UTC+0)
signal strength 4 of 5
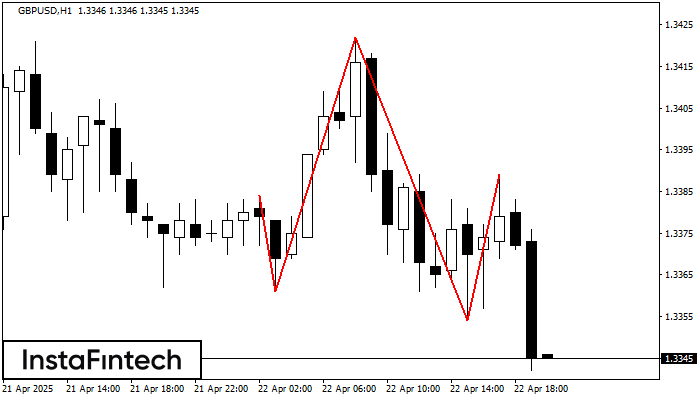
The GBPUSD H1 formed the Head and Shoulders pattern with the following features: The Head’s top is at 1.3422, the Neckline and the upward angle are at 1.3361/1.3354. The formation
Open chart in a new window